
Figure 3.
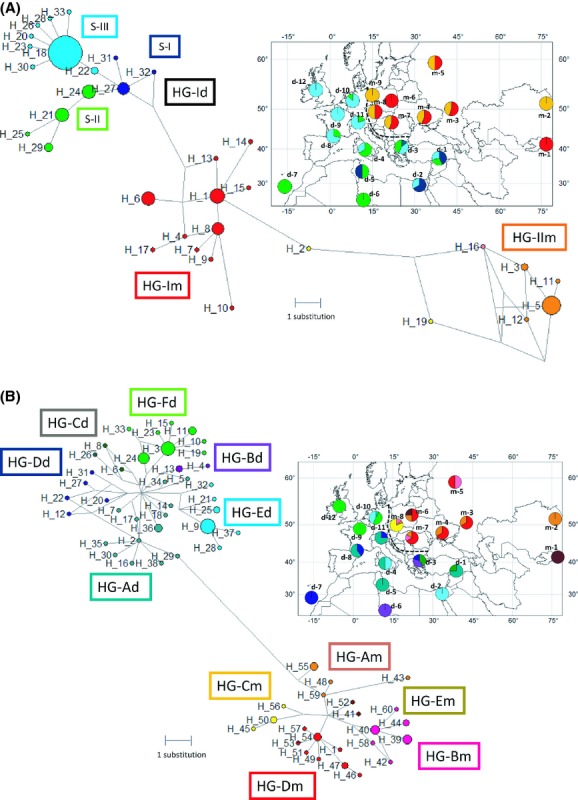
(A) Haplotype network and haplogroup distribution of Tlr4, H_haplotypes, HG-, haplogroups, S- subgroups identified in Figs. S1a and S2a. The size of circles corresponds to the frequency of haplotypes; length of lines is related to the number of substitutions. More detailed information can be found in Table S1. The inset figure represents the geographical distribution of HGs. Color circles on the map represent the proportion of particular HG or S (colors correspond to the haplotype network), labels indicate geographic assignment to population groups detailed in Table S1; dashed line shows the position of the house mouse hybrid zone. H_2 and H_19 were excluded from HG due to recombination (see the text for more details). (B) Haplotype network and haplogroup distribution of mt-Cytb, H_ identified haplotypes, HG-, identified haplogroup. The size of circles corresponds to the frequency of haplotypes; length of lines is related to the number of substitutions. More detailed information can be found in Table S1. The inset figure represents the geographical distribution of HGs. Color circles on the map represent the proportion of particular HG (colors correspond to the haplotype network); labels indicate geographic assignment to population groups detailed in Table S1; dashed line shows the position of the house mouse hybrid zone.