
Figure 4.
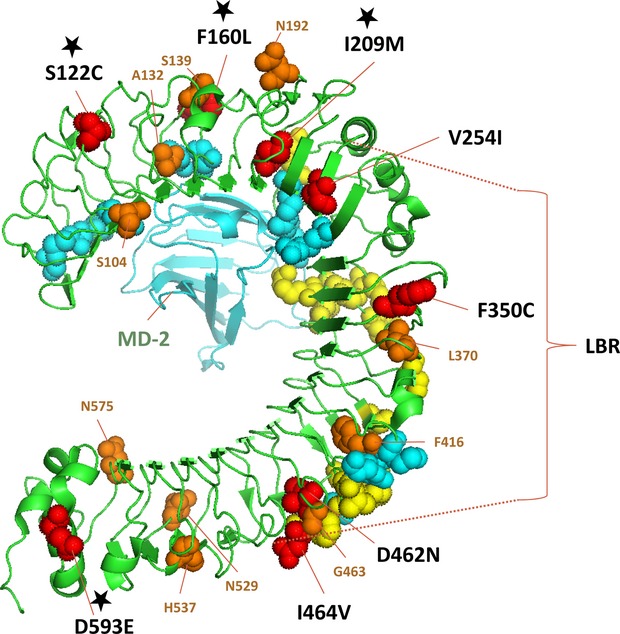
Ribbon diagram of the TLR4 extracellular domain (ECD) 3D structure (PDB 2z64 from RCSB PDB Protein Data Bank, http://www.rcsb.org/pdb/explore.do?structureId=2z64, functional sites were described according to (Kim et al. 2007; Park et al. 2009; Ohto et al. 2012) and important substitutions were visualized as amino acid space-fill models: cyan corresponds to binding positions for MD-2, yellow represents binding sites for lipopolysaccharides (LPS), red represents nonsynonymous amino acid changes, orange represents sites under negative selection detected between subspecies by random effects likelihood (REL); black stars represent detected sites under positive selection differing between the subspecies as revealed by REL; the TLR4 ECD is represented by green color, MD-2 is represented by cyan color, LBR, Ligand-Binding Region is marked by dashed lines. Description of sites responsible for LPS binding and MD-2 binding is in Table S2, modeling of different sites and design correction made in PyMOL Version 1.5.