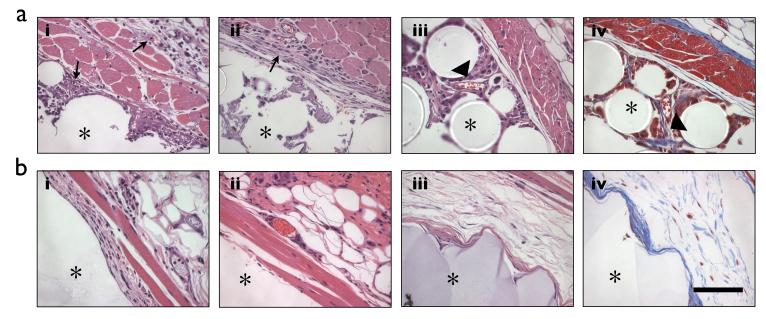
Figure 3. Characterization of tissue response by histology.
(a) Representative sections of subcutaneous tissue implanted with polystyrene beads for 1 (i), 7(ii) or 28 (iii and iv) days and stained with H&E (i-iii) or Masson’s Trichrome (iv). Arrows indicate the presence of phagocytic cells (i and ii) and arrowheads indicate the presence of fibroblasts (iii) or collagen fibrils (iv). (b) Representative sections of subcutaneous tissue implanted with alginate beads for 1 (i), 7 (ii) or 28 (iii) days and stained with H&E (i-iii) or Masson’s Trichrome (iv). Asterick (*) denotes the region with the material. Scale bar, 100 μm.

