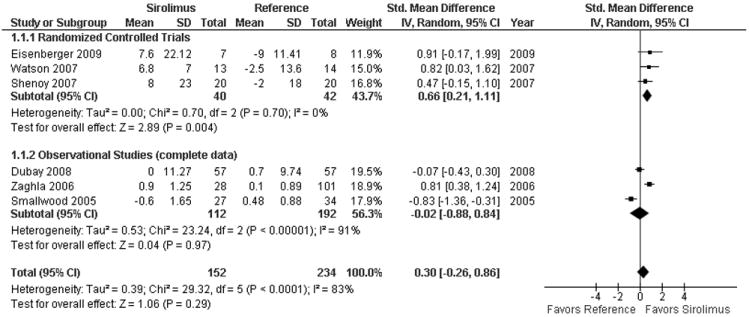
Figure 2. Standardized Mean Difference of change in renal function from initiation of sirolimus to 1 year.

Test for subgroup interaction was non significant (p=0.17). After back transformation into the eGFR scale, sirolimus was associated with an improvement of 3.38 ml/min (95% CI -2.93 to 9.69). Borderline eligible observational studies are not included (see appendix 6). Smallwood 2005 and Zaghla 2006 only reported creatinine. The mean values in studies reporting serum creatinine were multiplied by -1 to make the scale uniform.
