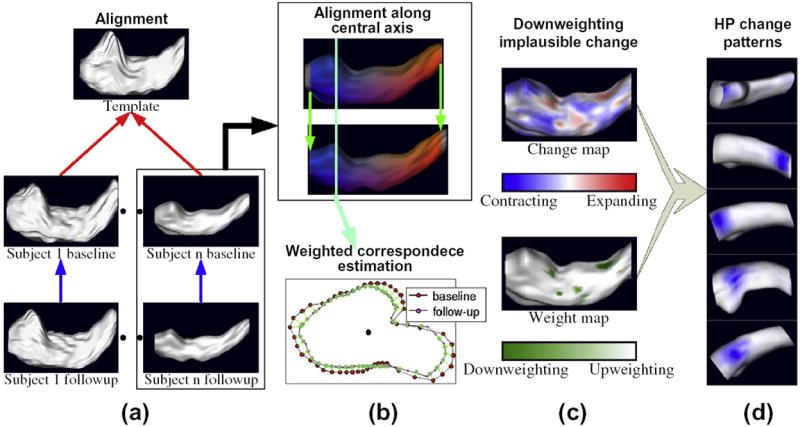
Fig. 1.

Framework for measuring longitudinal localized hippocampus change. (a) Follow-up HP are aligned to baseline HP (blue arrows) and baseline HP are aligned to a common template (red). (b) The alignment consists of deforming and shifting HP along their central axes, cutting off structure end slices not shared between the pair (top), and establishing weighted correspondences at each surface point (bottom). (c) Rates of local HP radius decrease are estimated (top) and points with implausible change rates are down-weighted. (d) Spatial patterns of coherent HP change (blue spots) are generated by a version of LoCA that accounts for the down-weighting. (For interpretation of the references to colour in this figure legend, the reader is referred to the web version of this article.)
