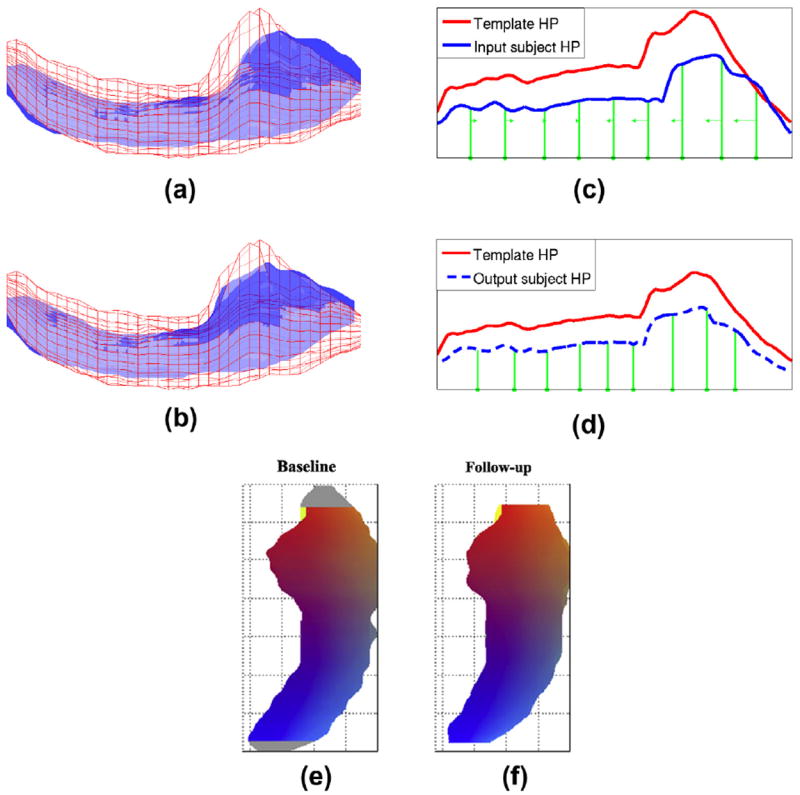
Fig. 2.

A baseline subject HP (blue surface) and a template HP (red wireframe) are shown overlaid before (a) and after (b) alignment from an inferior viewpoint. The curves plotting maximum distance from surface points to the central axis in each slice drive the alignment, and are more similar after alignment (d) than before (c). Green lines show positions of control slices before alignment (c) and after (d), with the direction and magnitude of control slice motion indicated by arrows. (e) (f) After baseline and follow-up HP are aligned, it is very common for end slices to occur in one HP that have no obvious counterpart in the other (gray). There slices are removed prior to change rate estimation. (For interpretation of the references to colour in this figure legend, the reader is referred to the web version of this article.)
