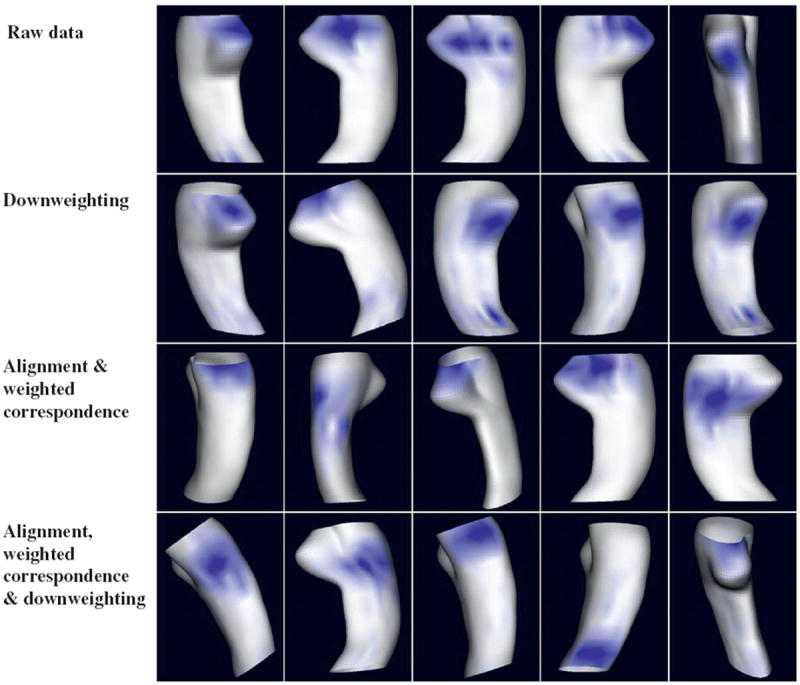
Fig. 8.

For 4 differing algorithm variants, the 5 LoCA change patterns accounting for the greatest amount of HP change rate variability are shown. For each rendering, the change pattern accounts for a coherent pattern of change in the region shown in blue. (For interpretation of the references to colour in this figure legend, the reader is referred to the web version of this article.)
