
Fig. 2.
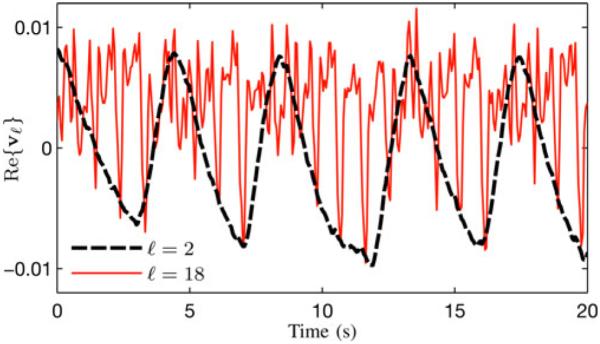
Separation of respiratory and cardiac signal changes in the SVD of a typical human cardiac MR dataset. The Casorati matrix was created from data measured at a limited number of k-space locations. The figure plots the real parts of v2 and v18, respectively. Both vectors are complex, but only the real parts are shown for the purposes of simplicity. As can be seen, v2 contains the low-frequency signal changes (related to respiratory motion), whereas v18 captures faster cardiac motion.