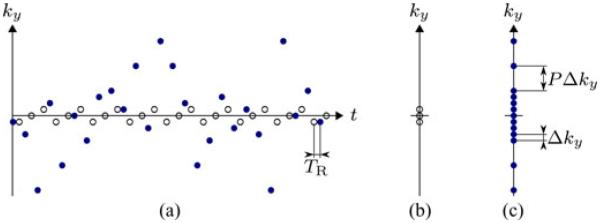
Fig. 3.

Illustrative example of the sampling patterns implemented throughout this paper. Subfigure (a) depicts the (k, t)-space sampling schedules for D1 (outlined circles) and D2 (filled circles) for 2-D imaging with parameters Nd = 3, NACS = 9, and P = 4. Subfigures (b) and (c) depict the k-space sampling locations respectively.
