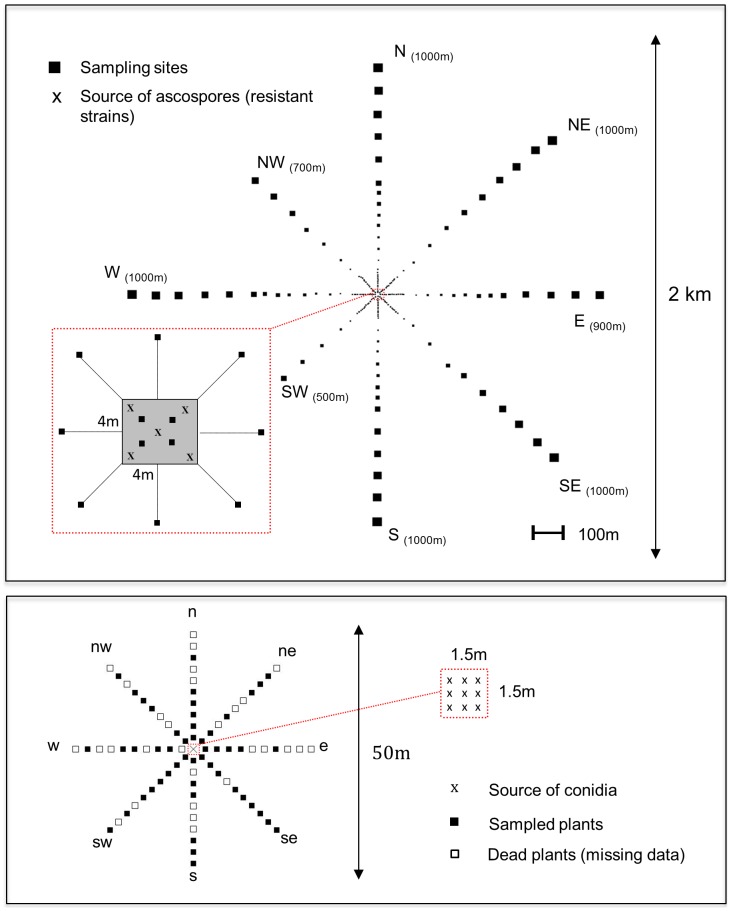
Figure 1. Plots layout of both ascospores and conidia experimental designs implanted in Cameroon.
For the ascospores system (upper panel), the sizes of the squares (schematizing sampling sites) are proportional to the number of trap plants and the number into brackets indicates for each axis the distance between the centre and the most distant sampling site.

