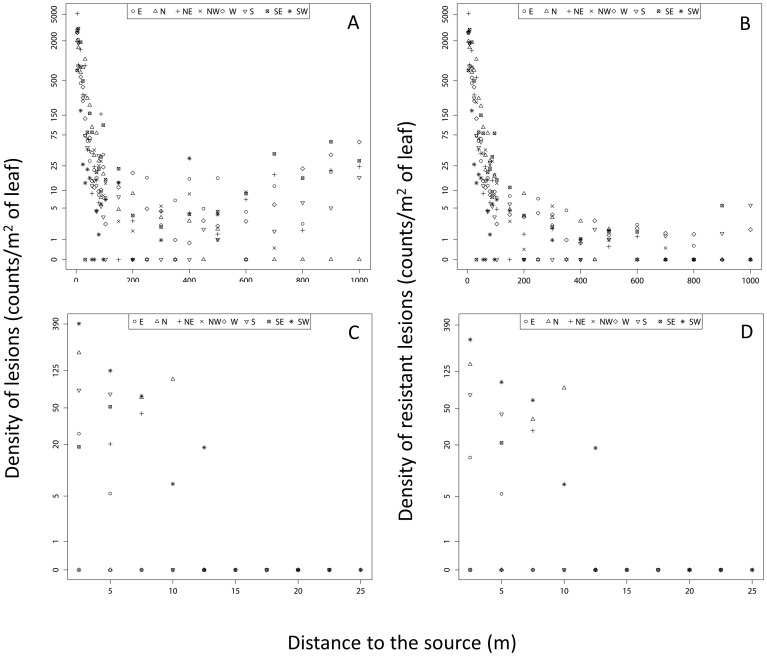
Figure 2. Disease gradient measured in the field.
Density of lesions (i.e., DL, A & C) and density of resistant lesions (i.e., DRL, B & D) as a function of geographical distances from the central source. Top: ascospores site (A & B); Bottom: conidia site (C & D). The different axis of the experimental design are represented separately using different symbols. DL and DRL are plotted in “log (1+the value)” scale but values are indicated in natural scales.

