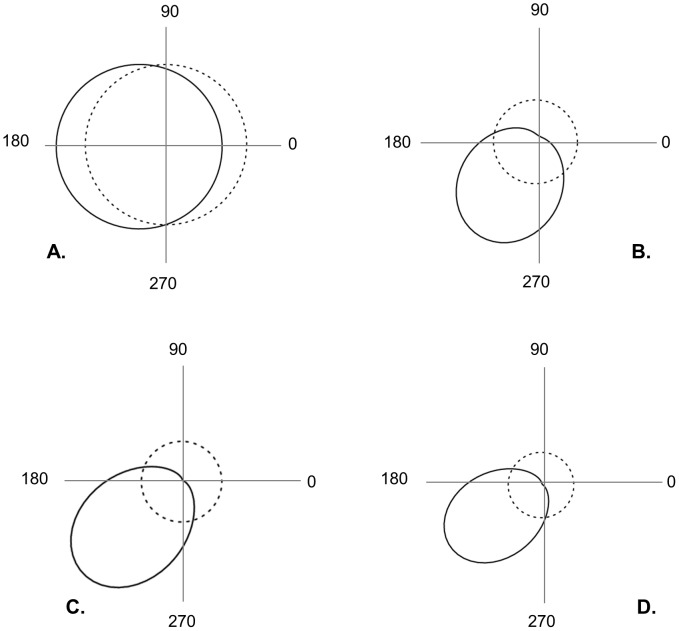
Figure 4. Anisotropy functions estimated from the exponential power dispersal kernel.
Estimated directional functions (solid lines, A&C for the density and B&D for the mean distance) are compared to their equivalent uniform functions (dotted lines) for both the ascospores (A&B) and conidia (C&D) experimental site. See Table 1 for details on values and statistical support. Directional angles are given in degrees.

