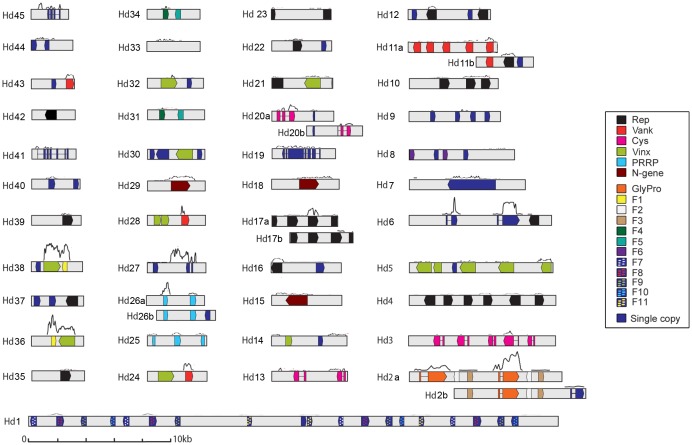
Figure 1. Graphic representation of the HdIV genome and transcribed regions.
The 50 HdIV segments are shown in linear form, from the smallest (Hd45, 2548 bp) to the largest (Hd1, 36006 bp). Pairs of HdIV segments with similar sequences were designated, the two segments of each pair being named a and b. Colored boxes show the open reading frames (ORFs). Refer to the legend for color correspondences. Introns within ORFs are indicated by a line between two colored boxes (corresponding to exons). A “transcript coverage curve” is shown above each HdIV segment (i.e. the number of Illumina reads mapping to the segment sequence; for the sake of simplicity, only data from one of the 3 “72 h p.p.” replicates were used to draw the curve). Provisional GenBank accession numbers: Hd45:KJ586284; Hd44:KJ586285; Hd43:KJ586286; Hd42:KJ586287; Hd41:KJ586288; Hd40:KJ586289; Hd39: KJ586290; Hd38:KJ586291; Hd37:KJ586292; Hd36:KJ586293; Hd35:KJ586294; Hd34:KJ586295; Hd33: KJ586296; Hd32:KJ586298, Hd31:KJ586299; Hd30:KJ586300; Hd29:KJ586303; Hd28:KJ586304; Hd27:KJ586305; Hd26b:KJ586306; Hd26a:KJ586301; Hd25:KJ586307; Hd24:KJ586308; Hd23:KJ586309; Hd22:KJ586310; Hd21:KJ586311; Hd20b:KJ586297; Hd20a:KJ586312; Hd19:KJ586313; Hd18:KJ586315; Hd17b:KJ586316; Hd17a:KJ586314; Hd16:KJ586317; Hd15:KJ586318; Hd14:KJ586319; Hd13:KJ586320; Hd12:KJ586321; Hd11b:KJ586302; Hd11a:KJ586322; Hd10:KJ586323; Hd9:KJ586324; Hd8:KJ586325; Hd7:KJ586326; Hd6:KJ586328; Hd5:KJ586329; Hd4:KJ586330; Hd3:KJ586331; Hd2b:KJ586327; Hd2a:KJ586332; Hd1:KJ586333.

