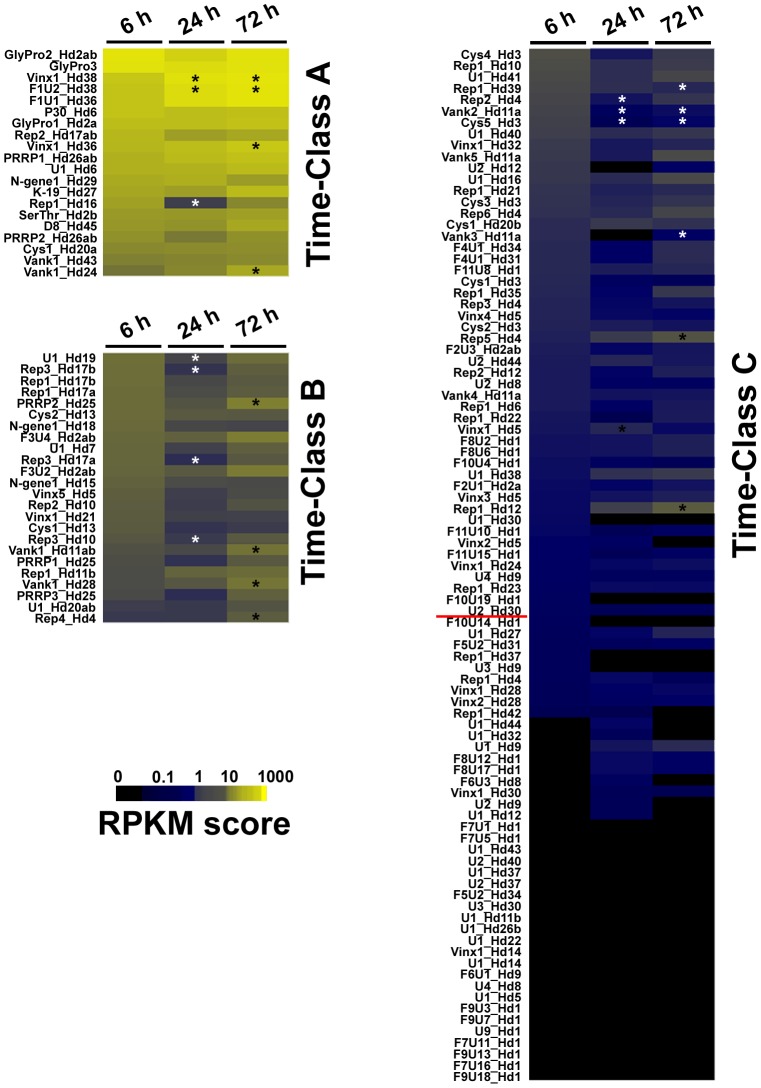
Figure 2. Profile of HdIV transcript levels during the time-course of S. frugiperda parasitization.
Each row represents the mean RPKM value for each of the 135 HdIV genes analyzed in S. frugiperda at 6 h, 24 h and 72 h p.p. The color scale (black to yellow) indicates RPKM level. The RPKM values were used to cluster genes into classes (A, B and C) with the AutoClass algorithm available from the AutoClass@IJM website. Asterisks indicate significant (p>0.05) RPKM fold-changes with respect to the arbitrary chosen reference (Sf 6 h p.p. sample). White asterisks indicate a significant decrease and black asterisks indicate a significant increase in transcript levels (fold-changes ranging from 2 to 67).

