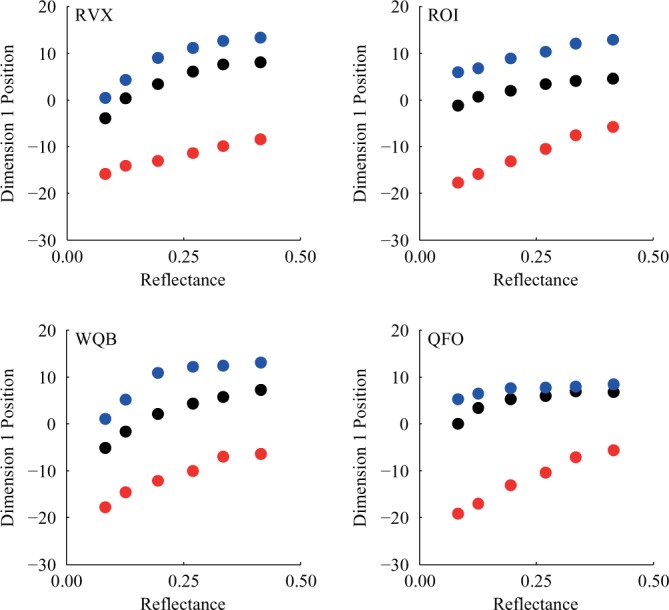
Figure 4.

Observers in Experiment 1 were not perfectly lightness constant. Plots of the one-dimensional MDS position against the surface reflectance of the test cards. Each color represents a different context, with blue as Context 1, black as Context 2, and red as Context 3. Observers whose data are plotted in the panels on the left received Instruction Set A (reflectance) while observers whose data are plotted on the right received Instruction Set B (reflected light).
