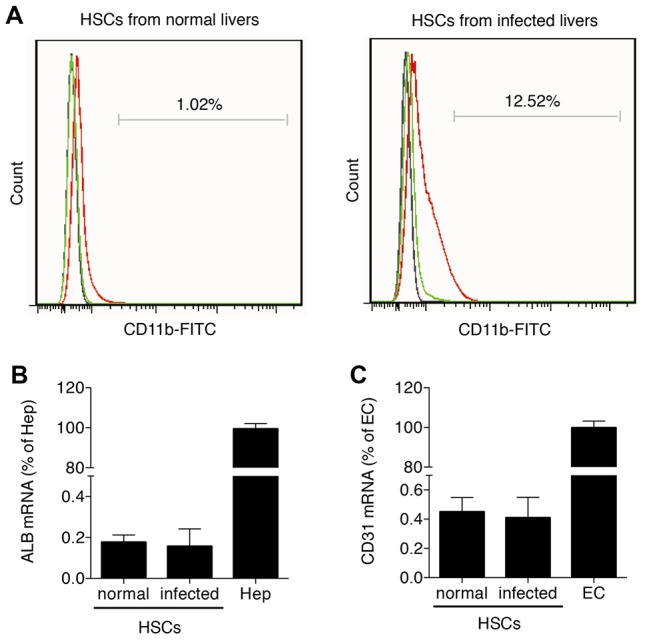
Figure 3. Detection of the purity of primary HSCs.

Primary HSCs were isolated from three to five uninfected mice and from infected mice on day 42 post-infection. (A) Flow cytometric analysis of HSCs from uninfected and infected mice using FITC conjugated CD11b mAb compared with a concentration-matched IgG isotype control. HSCs before Kupffer cell depletion are shown in green, while HSCs after Kupffer cell depletion are shown in red. The control is shown in black. Contamination of Kupffer cell-depleted HSCs with hepatocytes (B) and endothelial cells (C) was analyzed by real-time PCR for ALB and CD31, respectively. Results were normalized to GAPDH and are expressed as mean fold ± standard deviation (SD) and compared with primary hepatocytes (“Hep” = 100%) and primary hepatic endothelial cells (“EC” = 100%).
