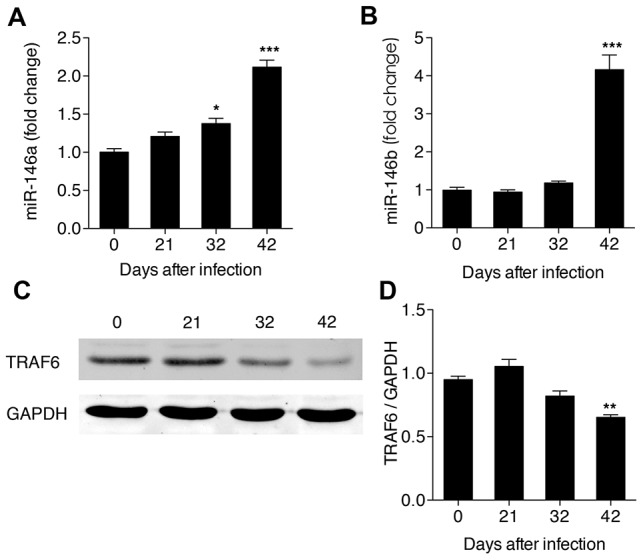
Figure 6. Expression levels of miRNA-146 in HSCs in hepatic schistosomiasis.

Expression levels of (A) miR-146a and (B) miR-146b in total RNAs detected by real-time PCR, and (C, D) Band pattern and TRAF6 levels in total protein detected the by western blot. *P<0.05, **P<0.01, ***P<0.001, compared with samples from the first day of infection (day 0).
