
Figure 5.
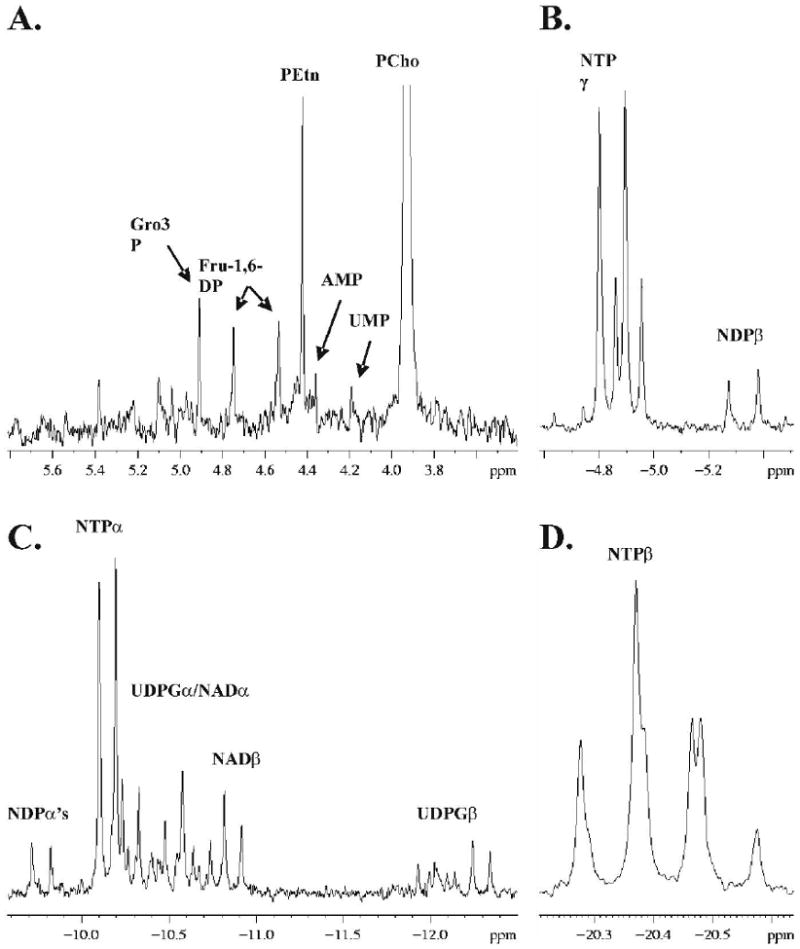
Regions of high signal density from 31P MR spectra of cell extracts (MCF-7 spectrum shown): PME/sugar phosphate region (A), NTPγ region (B), NTPα region (C) and NTPβ region (D). Peak assignments are: glycerol-3-phosphate (Gro3P), fructose-1,6-diphosphate (Fru-1,6-DP), phosphoethanolamine (PEtn), adenosine monophosphate (AMP), uridine monophosphate (UMP), phosphocholine (PCho), nucleotide triphosphate (NTPγ, -α, -β), nucleotide diphosphate (NDPβ, -α), uridine diphosphate-glucourinate, -glucose, -galactose, -N-acetylglucosamine, -N-acetlygalactosamine (UDPGα, -β), and nicotinamide adenine dinucleotide (NADα, -β).