
Figure 6.
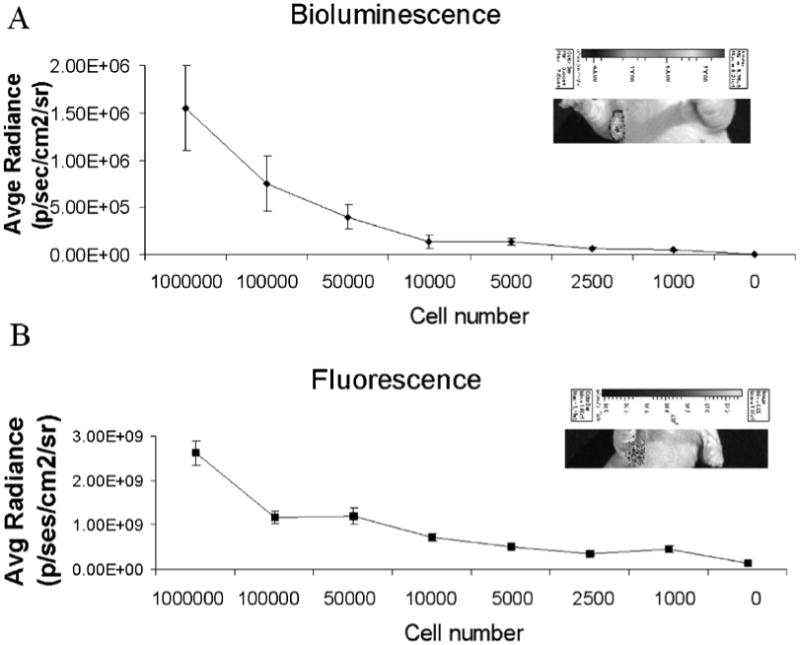
Sensitivity of detection of cells injected into the ALN. (A) Bioluminescence activity quantified for a range of injected cell numbers. Inset shows signal for a mouse injected with 1000 cells. (B) Agent associated fluorescence for a range of cell numbers, 24 h post-injection with MamAb-680. Inset shows fluorescence for a mouse injected with 1000 cells. All data represent mean ± s.d. of pixel values within the ROIs.