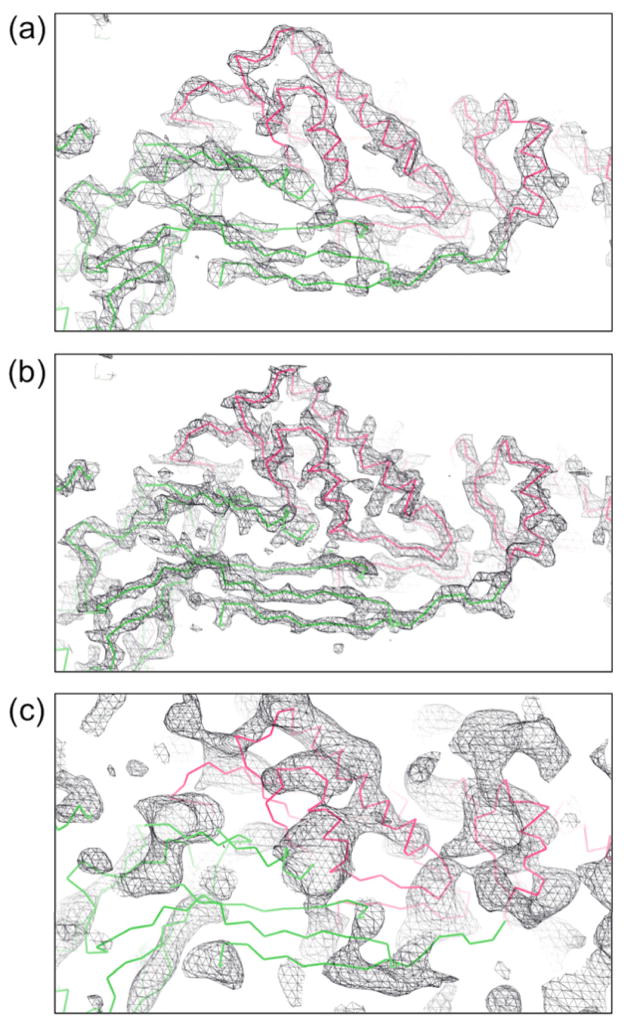
Fig. 6. Map quality possibilities.
Maps at different resolution limits were generated using calculated structure factors for all observed and unobserved reflections assuming the EM based model. A temperature factor of 200 Å2 was used for this calculation, corresponding to the effective temperature factor of the observed data (a) at 5.0 Å and (b) at 4.0 Å resolution. In (c) is shown the current, model unbiased map calculated to 6.8 Å resolution based on isomorphous replacement, anomalous dispersion and 2-fold NCS averaging using only the reflections greater than 0.8σ.

