
Figure 3. Simulation study: Power comparison.
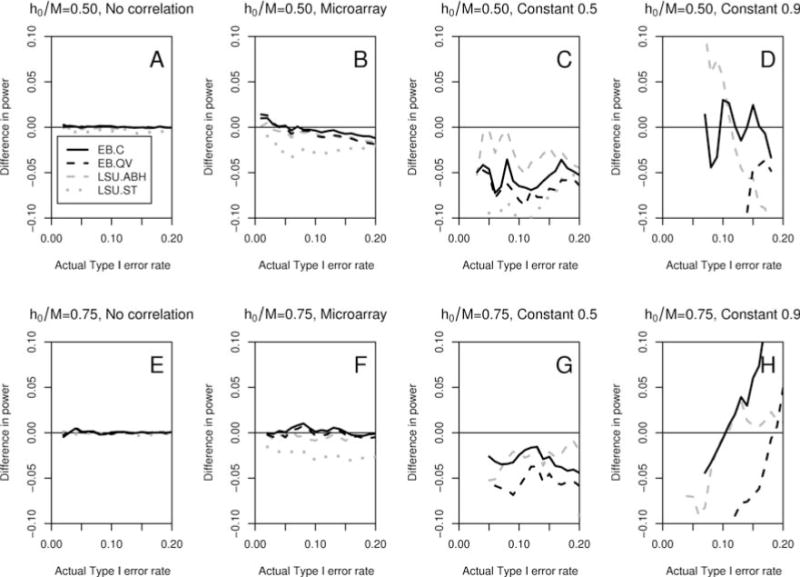
Plots of differences in power vs. actual Type I error rate, for FDR-controlling procedures EB.C, EB.QV, LSU.BH, LSU.ABH, and LSU.ST, summarized in Table 1, using LSU.BH as baseline. Results correspond to the following simulation parameters: sample size n = 250, number of null hypotheses M = 400, common alternative shift parameter dn(m) =2, ; proportion of true null hypotheses (h0/M = 0.50, 0.75) and correlation structure (σ* = “No correlation”, “Microarray”, “Constant 0.5”, “Constant 0.9”) indicated in the panel titles; B = 10,000 resampled test statistics and sets of true null hypotheses; A = 500 simulated datasets. Positive (negative) differences indicate greater (lower) power than the baseline LSU.BH procedure. (Color version on website companion.)