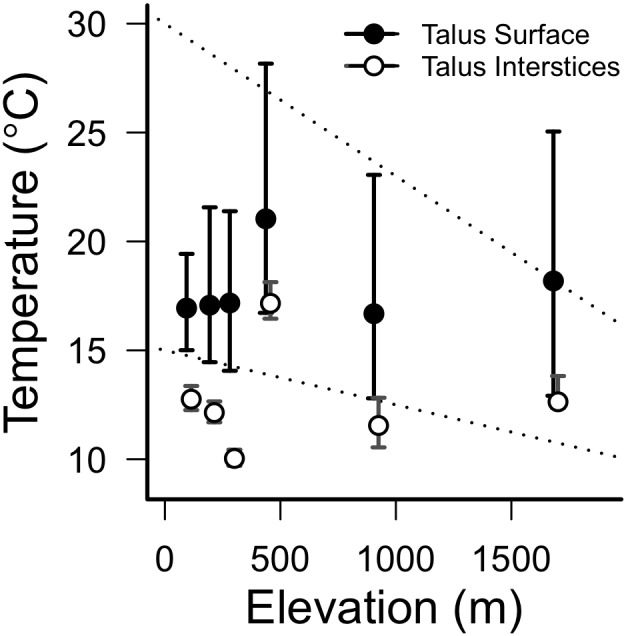
Figure 4. Average summer temperatures by elevation.

Points represent mean summer temperatures at the talus surface (filled) and 1 m into talus interstices (open). Bars range from mean daily maxima to mean daily minima in each of these habitats. To show bars that overlap, interstitial points are shifted right by 20 m at some sites. Dotted lines represent previously-calculated lapse rates for the Pacific Northwest, from [39].
