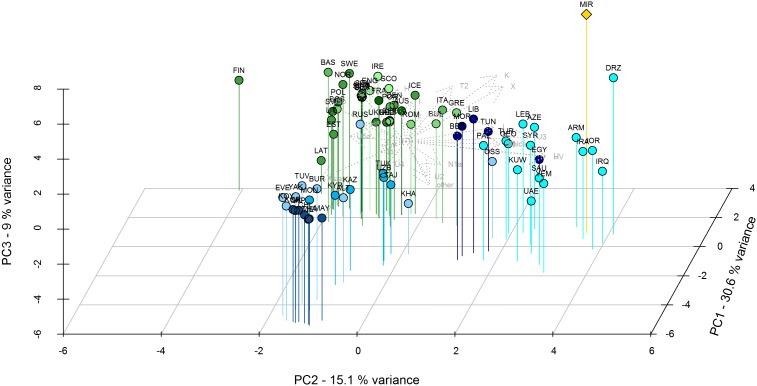
Figure 3. Principal component analysis of El Mirador and present-day African, Asian and European populations.
Principal component analysis (PCA) based on mitochondrial haplogroup frequencies of El Mirador (MIR, yellow) and published present-day populations [21]: African/Asian (in blue, from darker to lighter North Africa, Southwest Asia, Central Asia, North Asia and Southwest Asia) and European (in green, from darker to lighter, Central, East, North, South, Southwest and West). For further information about populations, abbreviation and frequencies, see Table S1. The first three principal components display the 54.5% of the total variance.

