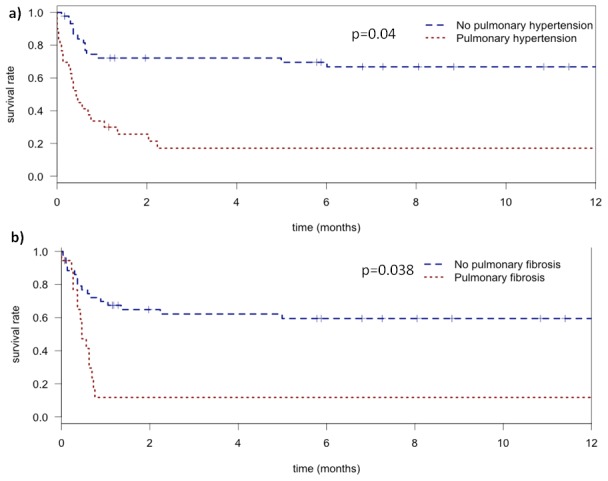
Figure 2. Kaplan-Meier curves of the probability of survival during 1 year after ICU admission.

a) in patients with (red) and without (blue) pulmonary hypertension. b) in patients with (red) or without (blue) fibrosis (bronchiectasis/honeycombing) by CT.
