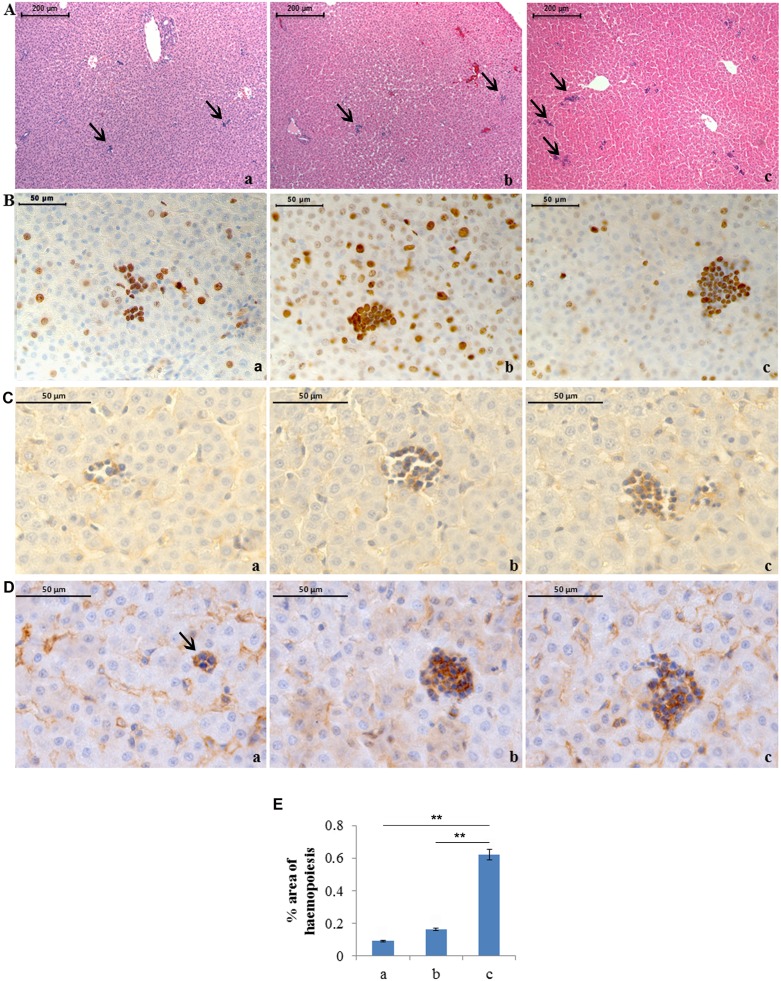
Figure 1. Severe hyperoxia increases liver haemopoiesis.
A) Haematoxylin-eosin staining of neonatal rat livers exposed to moderate and severe hyperoxia. a) ambient air; b) 60% hyperoxia; c) 95% hyperoxia. Arrows indicate haemopoietic foci. Scale bar: 200 µm, magnification 10x. B) Anti-ki67 immunohistochemistry showing diffuse positivity of haemopoietic cells. Scale bar: 50 µm, magnification 40x. C) Anti-CD34 immunohistochemistry showing diffuse positivity of haemopoietic cells. Scale bar: 50 µm, magnification 63x. D) Anti-CD45 immunohistochemistry showing diffuse positivity of haemopoietic cells. Scale bar: 50 µm, magnification 63x. E) Graphic representation of the mean values of the percentage area of liver haemopoietic foci (±SD) determined in ten fields for each of three slides per sample. ** = p<0.01.

