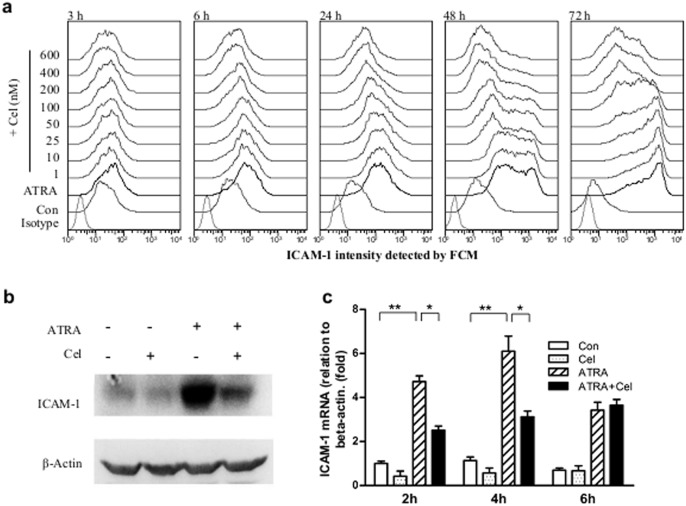
Figure 3. Effects of celastrol on ICAM-1 expressions in ATRA-induced NB4.
(a) Histograms of ICAM-1 expressions in NB4 cells with different treatments. NB4 cells were treated with celastrol at different doses for 30 min prior to loading 1 µM of ATRA. Cell surface levels of ICAM-1 were detected by flow cytometry at the indicated times after co-culture, with the ATRA loading time as the starting point. (b) Western blot detection of total amount of ICAM-1 in cells. NB4 cells were pre-treated with celastrol at 200 nM for 30 min, then 1 µM of ATRA loaded. The culture process continued for 6 hours and then the whole protein was extracted and ICAM-1 detected by Western blot. β-actin was used as internal control. (c) Quantitative RT-PCR detection of ICAM-1 mRNA in NB4. NB4 cells were pre-treated with celastrol at 200 nM for 30 min, then 1 µM of ATRA loaded. The culture process continued for the indicated times, after which total RNA was extracted and ICAM-1 mRNA detected with quantitative RT-PCR. β-actin was used as internal control. The data are shown as mean ± SE, * represents P<0.05, while ** represents P<0.01. Sample size (n) was 3.

