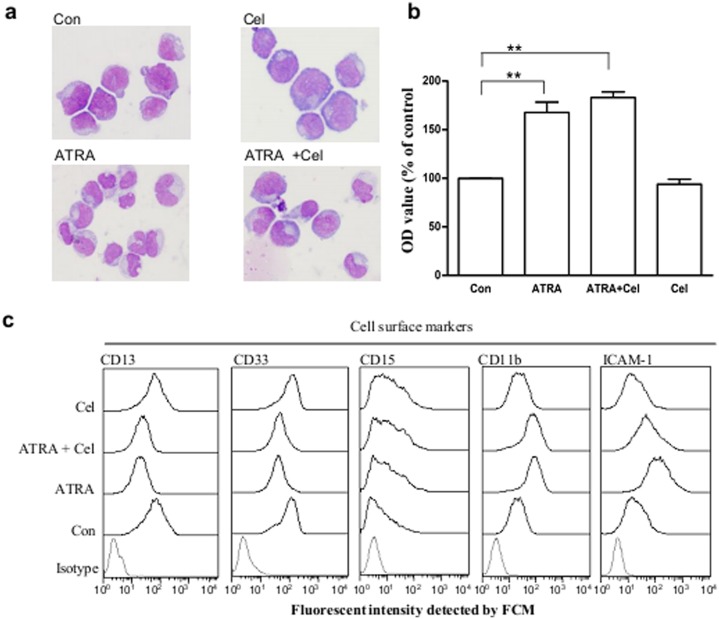
Figure 5. Effects of celastrol on ATRA-induced differentiation in NB4.
(a) Morphologic observations of NB4 cells with different treatments. NB4 cells were pre-treated with celastrol at 200 nM for 30 min, then 1 µM ATRA added for 96 h culturing. Cells were subjected to Wright’s staining before examination with microscope under higher power field. (b) NB reduction ability in different cells. Cell treatment is the same as in panel A. NB reduction ability was determined by colorimetric method. Data are reported as mean ± SE, with a sample size of three. (c) Cell surface markers in NB4 cells with different treatments. Cell treatment is the same as in panel A. After treatment, the surface markers in NB4 were detected by flow cytometry. The data are shown as mean ± SE, ** represents P<0.01, with a sample size (n) of 3.

