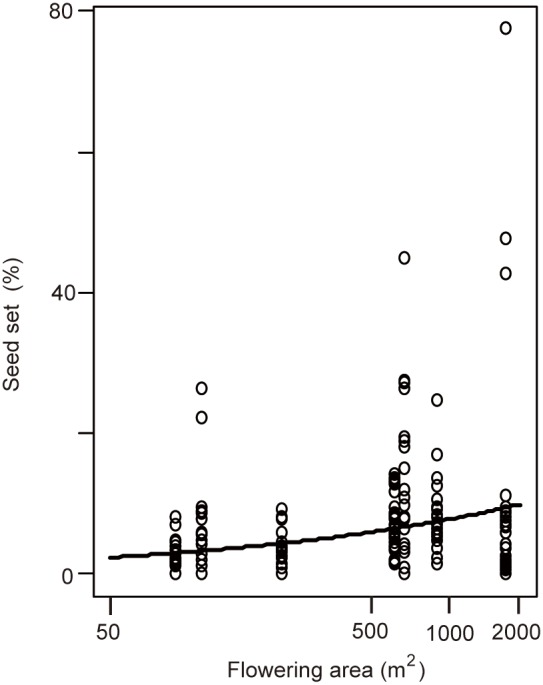
Figure 2. Seed set and flowering areas for the seven sites.

The fitted values (solid line) are shown for the best binomial generalized linear mixed-effect model using the seven sites. Each open circle indicates the value for a single culm.

The fitted values (solid line) are shown for the best binomial generalized linear mixed-effect model using the seven sites. Each open circle indicates the value for a single culm.