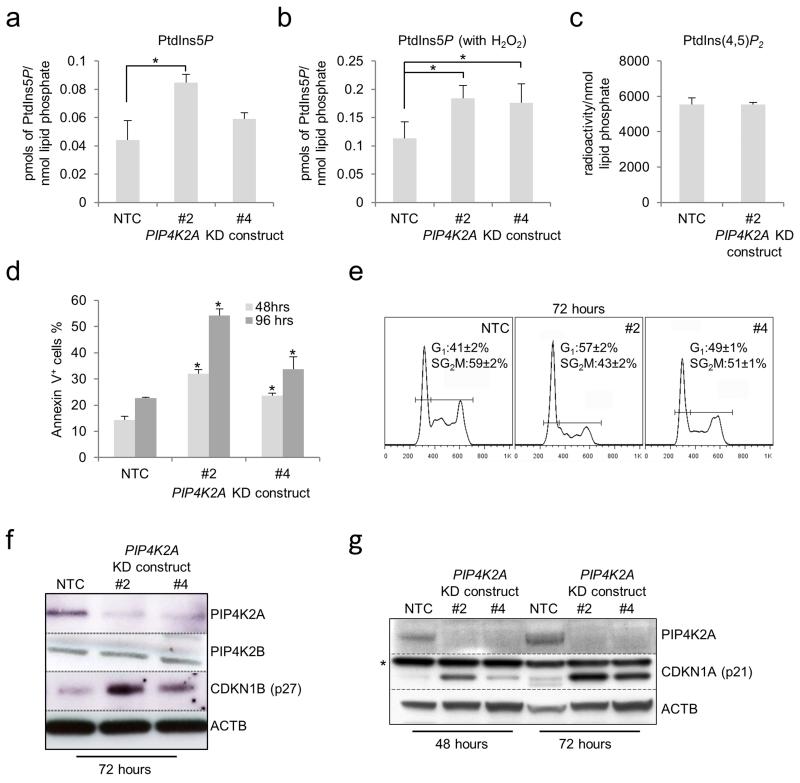
Figure 2.
Consequences of PIP4K2A KD in human THP1 AML cells. Human THP1 AML cells were infected with lentiviral vectors targeting PIP4K2A for KD, or a non-targeting control (NTC), with eGFP as the selectable marker. Bar charts show mean±STDEV (a) whole cell PtdIns5P levels, (b) whole cell PtdIns5P levels following 40 minutes of treatment of cells with 1mM H2O2 and (c) whole cell PtdIns(4,5)P2 levels in THP1 cells 48 hours following lentiviral infection with the indicated control or KD constructs (n=3). * indicates p<0.05, as assessed by one way ANOVA followed by Fisher’s least significant difference post hoc test. (d) Bar chart shows mean±SEM percentage of control or PIP4K2A KD cells exhibiting annexin V binding at the indicated time points following lentiviral infection (n=3). In each case >95% of cells were eGFP positive. * indicates p<0.05 by comparison with control cells at the same time point, as determined by one way ANOVA followed by Fisher’s least significant difference post hoc test. (e) Representative cell cycle profiles (excluding sub-G1 apoptotic cells) from control and PIP4K2A KD cells 72 hours following initiation of KD. Numbers indicate mean±SEM percentage of cells in each phase of the cell cycle from three separate experiments (p<0.05 for NTC versus #2 or #4, as determined by one way ANOVA followed by Fisher’s least significant difference post hoc test). (f & g) Representative western blots show expression of the indicated proteins in control and PIP4K2A KD cells 48 or 72 hours following initiation of KD. * indicates a non-specific band.

