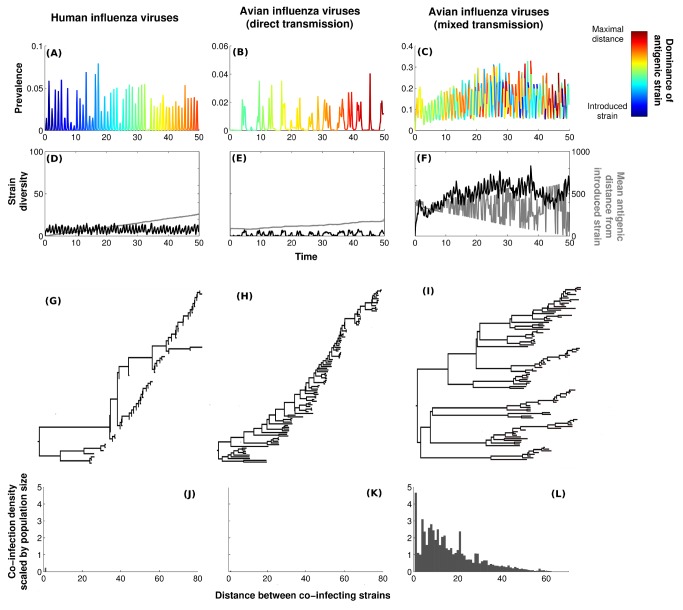
Figure 3. Phylodynamics of our individual-based model (IBM).
(A–C) Time series of influenza prevalence in humans, avian system with only direct transmission, and avian system with mixed transmission, respectively. Basic reproduction ratio, R 0, is set to 1.5 for direct transmission, and environmental durability is set at 20 d when this transmission route is included. Colors represent antigenic distance between the introduced strain and the dominant variant at time t. (D–F) The black line represents antigenic diversity through time (i.e., number of antigenic strains), whereas the grey line demonstrates temporal changes in the antigenic distance of the dominant strain to the introduced strain. Time is expressed in years. (G–I) Associated reconstructed phylogenies (see Text S1, section S3.3). (J–L) Co-infection patterns for the situations depicted previously. See Materials and Methods for parameter values and Text S1 (section S5) for sensitivity analyses.

