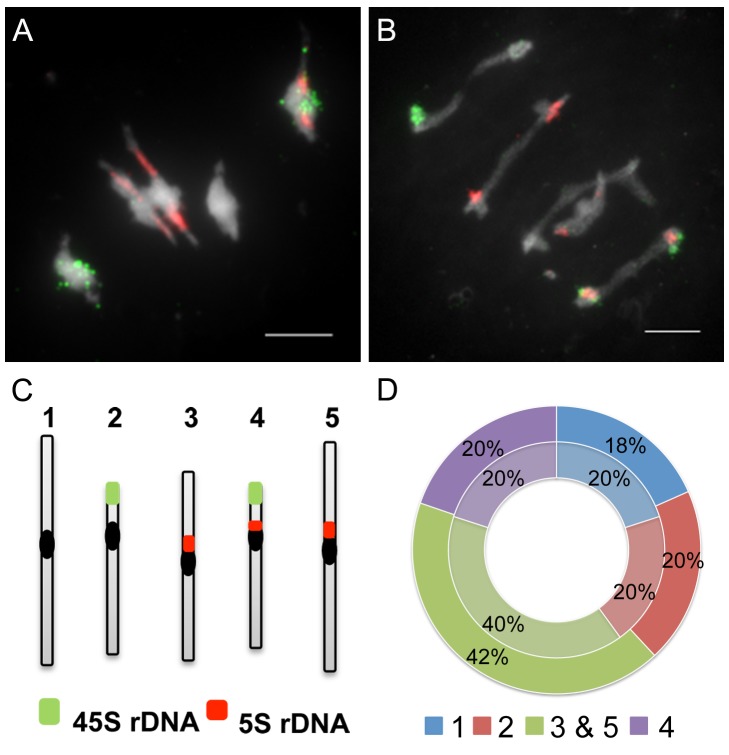
Figure 5. Bivalent shortage has a similar effect on each pair of chromosomes.
Fluorescent in situ hybridisation (FISH) on metaphase I cells was performed with probes directed against the 45S (green) and the 5S (red) rDNA, which allow the identification of chromosomes 1 (unlabelled), 2 (green labelled), and 4 (green and red labelled), whereas chromosomes 3 and 5 cannot be distinguished (red labelled). In wild type, each chromosome pair represents 20% of the total number of bivalents (A and D, centre circle, in light, n = 21 cells). In axr1 (B and D, N877898 allele, external circle, n = 28), the proportion of each bivalent pair is the same as in wild type. Bar = 5 µm.

