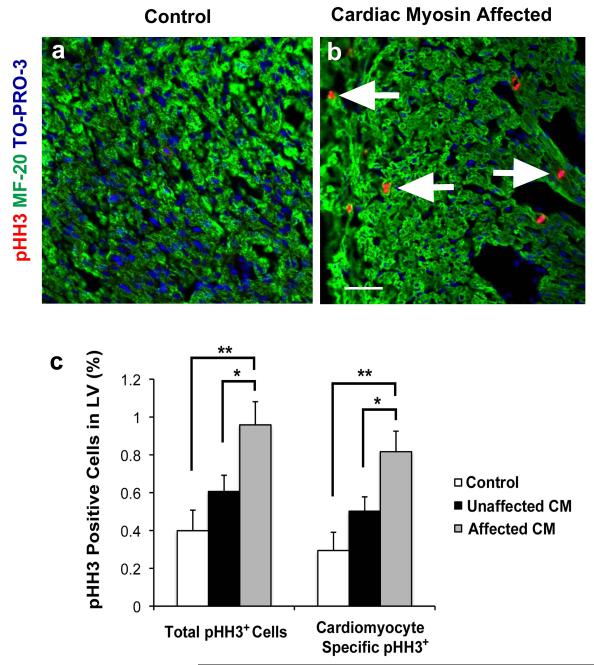
Figure 6. Increased total proliferation and cardiomyocyte specific proliferation of the LV myocardium in affected hearts with the HLHS phenotype.
(A-B) Adjuvant control and affected hearts stained with pHH3, MF-20, and TO-PRO-3. There were more pHH3 positive nuclei in the affected heart compared with adjuvant control. Arrows indicate pHH3 positive nuclei. (C) Histogram demonstrating that the percentage of pHH3 positive total cells was greater in the affected group (n = 15) compared with the unaffected group (n = 32) (*P = 0.05) and adjuvant control (n = 19 fetuses) (**P = 0.003) groups. Myocytes were identified by MF-20 stain and manually counted. Myocyte specific percentage of pHH3 positive cells was greater in the affected group compared with the unaffected (*P = 0.05) and adjuvant control (**P = 0.002) groups. Both affected and unaffected groups were immunized with CM. There is no difference between the unaffected group and the adjuvant control group in either total proliferation or cardiomyocyte specific proliferation. (A-B) 400x magnification. Scale bar = 50μm. Three variables (C) analyzed using two-way analysis of variance (ANOVA) with Tukey-Kramer adjustment for multiple comparisons. The data shown are the mean ± s.e.m.

