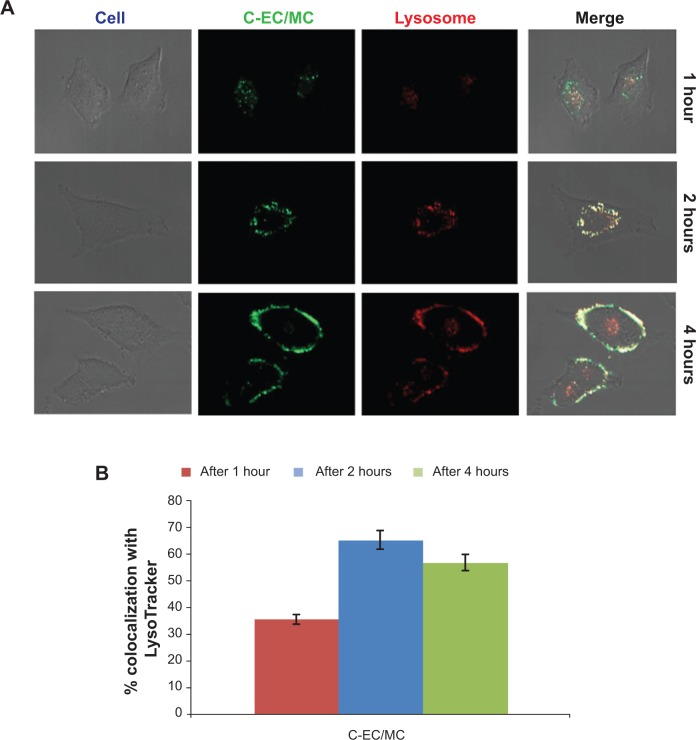
Figure 6.
Representative confocal microscopy images of (A) C-EC/MC nanoparticles (green) with LysoTracker (red) in HeLa cells. The colocalization between C-EC/MC nanoparticles and LysoTracker are shown in the merged images (yellow). (B) Quantification of colocalization analysis at different time points.
Abbreviations: EC, ethyl cellulose; MC, methyl cellulose; C, coumarin 6.

