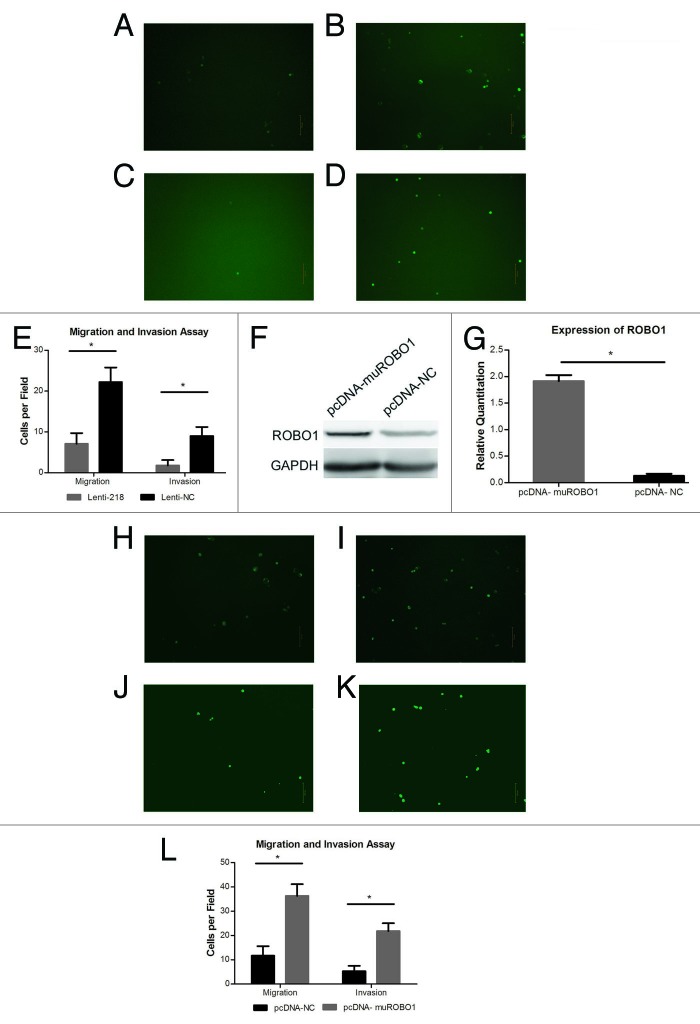
Figure 4. (A–D) Cells transfected with Lenti-218 (A) or Lenti-NC (B), migrated to the inferior surface of the transwell inserts in GFP vision (original magnification 100×). Cells transfected with Lenti-218 (C) or Lenti-NC (D), invaded to the inferior surface of the transwell inserts in GFP vision (original magnification 100×). (E) The mean migrated or invaded cell counts per field in each group. The mean migrated cell counts in Lenti-218 and Lenti-NC group were 7.100 ± 2.601 and 22.20 ± 3.584 respectively. The mean invaded cell counts in Lenti-218 and Lenti-NC group were 1.800 ± 1.317 and 9.000 ± 2.211 respectively. (F) The expression of ROBO1 protein in cells transfected with pcDNA-muROBO1 or control. An increased expressing level of ROBO1 protein was showed in pcDNA-muROBO1 group compared with pcDNA-NC group. (G) Expression of ROBO1 in cells transfected with pcDNA-muROBO1 or control. The relative quantitations of ROBO1 in pcDNA-muROBO1 group and pcDNA-NC group were 1.913 ± 0.1149 and 0.1307 ± 0.03800 respectively. (H–K) Cells transfected with pcDNA-NC (H) or pcDNA-muROBO1 (I), migrated to the inferior surface of the transwell inserts in GFP vision (original magnification 100×). Cells transfected with pcDNA-NC (J) or pcDNA-muROBO1 (K), invaded to the inferior surface of the transwell inserts in GFP vision (original magnification 100×). (L) The mean migrated or invaded cell counts per field in each group. The mean migrated cell counts in pcDNA-NC and pcDNA-muROBO1 group were 11.70 ± 3.917 and 36.30 ± 4.832 respectively. The mean invaded cell counts in pcDNA-NC and pcDNA-muROBO1 group were 5.300 ± 2.214 and 21.80 ± 3.259 respectively. P value < 0.05 was denoted as *.

An official website of the United States government
Here's how you know
Official websites use .gov
A
.gov website belongs to an official
government organization in the United States.
Secure .gov websites use HTTPS
A lock (
) or https:// means you've safely
connected to the .gov website. Share sensitive
information only on official, secure websites.
