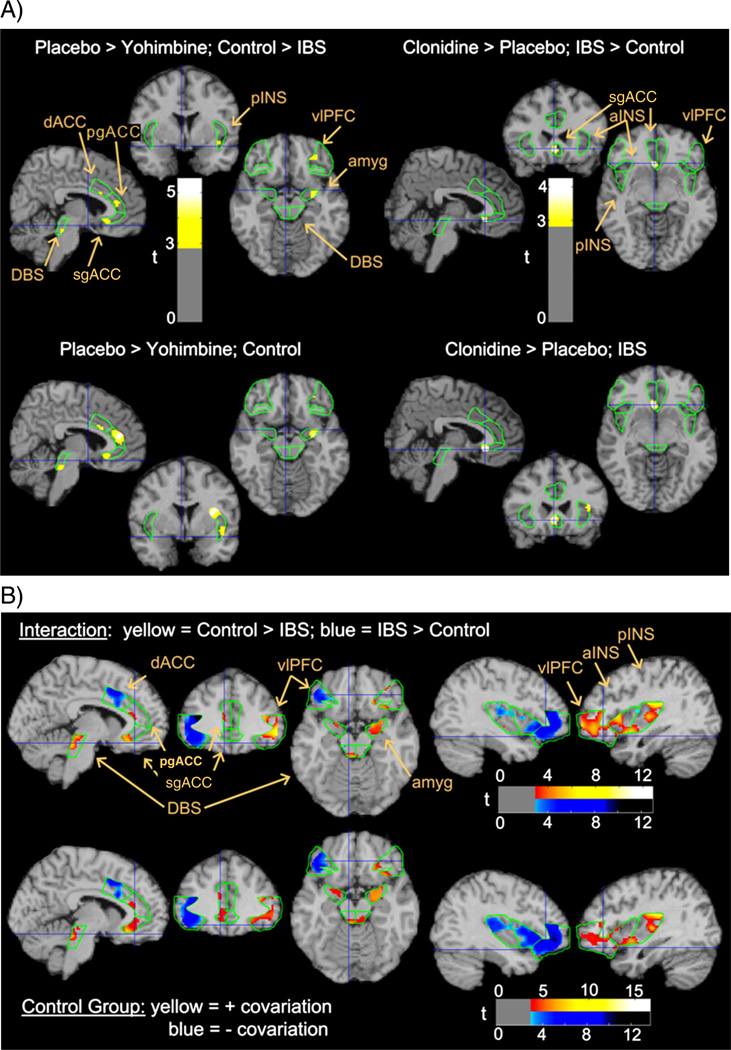
Fig. 3.
Functional connectivity of relative glucose metabolism in other regions of interest with activity in sgACC, and amygdala. Depicts areas of covariation across all scans between metabolism in other ROIs and seed regions within (A) sgACC depicted on sagittal slices 4 mm to the right of the anterior commissure, and (B) amygdala depicted on sagittal slices 6 mm to the right of the anterior commissure (see Fig. 1 for format and abbreviations).

