
Figure 4. Fasting insulin and glucose, and 2-hour glucose post-OGTT in NHANES are lower in EA soy consumers than soy non-consumers.
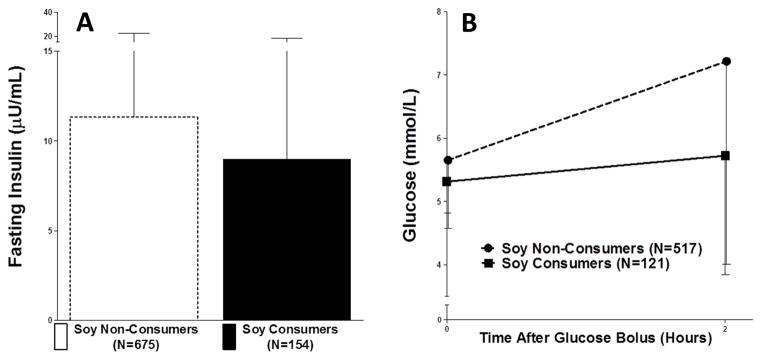
Fasting insulin was significantly lower in soy consumers (A. P=0.028 N=121 consumer, N=517 non-consumer), while fasting glucose trended towards being lower (B. P=0.091) and glucose 2-hours post-OGTT was significantly lower (C. P<0.0001).