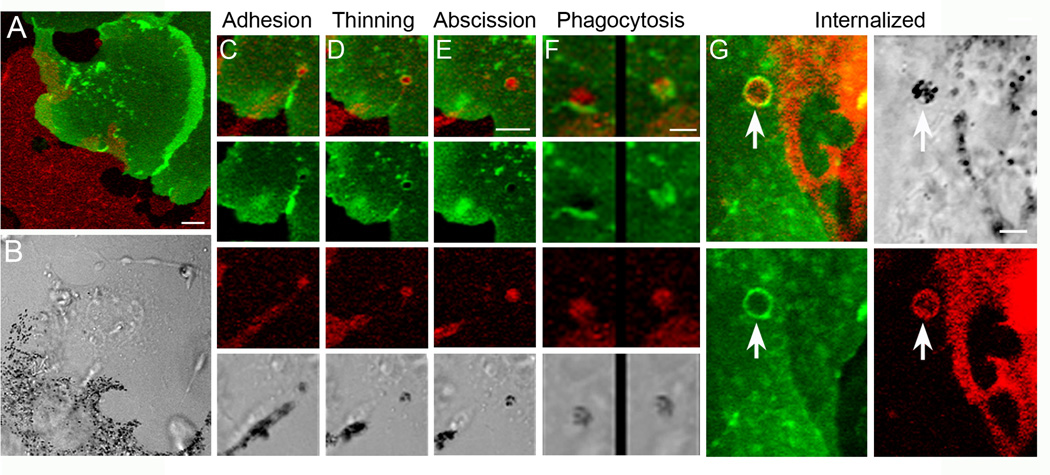
Figure 2. Time lapse imaging of “Holly” mice co cultures reveals the Shedding-Phagocytosis mechanism.
Panel A shows an image of a red melanocyte and a green keratinocyte in a primary skin culture prepared from a Holly mouse. Black melanosomes are easily visible in the transmitted light image in Panel B. Panels C–F show selected video frames that correspond to the four phases of the Shedding-Phagocytosis mechanism: adhesion of the tip of the melanocyte’s dendrite to the surface of the keratinocyte (Panel C), thinning of the dendrite behind the adhered tip (Panel D), package formation by apparent self-abscission (Panel E), and phagocytosis of the package by the keratinocyte (Panel F: two sequential video frames are shown) (in each case, the overlay of the green and red images is shown at the top, and the separate green, red and transmitted light images are shown underneath; note that Panel F is a higher magnification than Panels C–E). Panel G shows the membrane profiles of a shed package that has been internalized by a keratinocyte. An overlay of the green and red images is shown in the upper left, and separate green, red and transmitted light images are shown in the remainder of the panel. Mag bars are 5 μm (A and B), 3.8 μm (C–E), 2 μm (F), and 2.9 μm (G). Reproduced with permission from the Proceedings of the National Academy of Sciences [13] ••.

