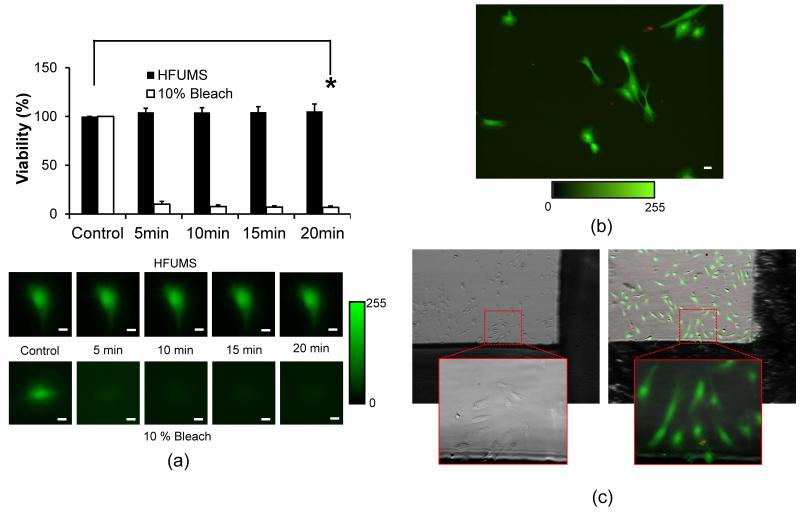
Fig. 6. Cell viability after HFUMS.
(a) Cell viability changes of HUVECs at the indicated time-points (0, 5, 10, 15, 20 minutes) after HFUMS application and 10 bleach treatment (input voltage: 18.96 Vpp, PRF: 1 kHz, and duty cycle: 0.5 %) (n=8) and the representative fluorescence images. The viability values were normalized by the value for the viability value obtained before application of HFUM (upper) and 10% bleach treatment (lower), respectively. (b) Fluorescence images for cell viability and toxicity in 1 hours after HFUM application. The green color indicates live cells whereas the red color indicates dead cells. (c) bright-field image (left) obtained before HFUM application and overlay of a bright-field and a fluorescence image (right) for cell viability and toxicity in 24 hours after HFUM application. The dotted-red rectangular indicates the area exposed to HFUM. The solid-red rectangular represents the magnified image (20×). Scale bar: 10 μm.

