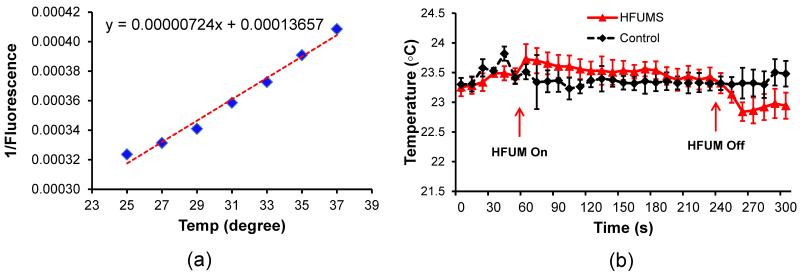
Fig. 7. HFUMS-induced temperature changes.
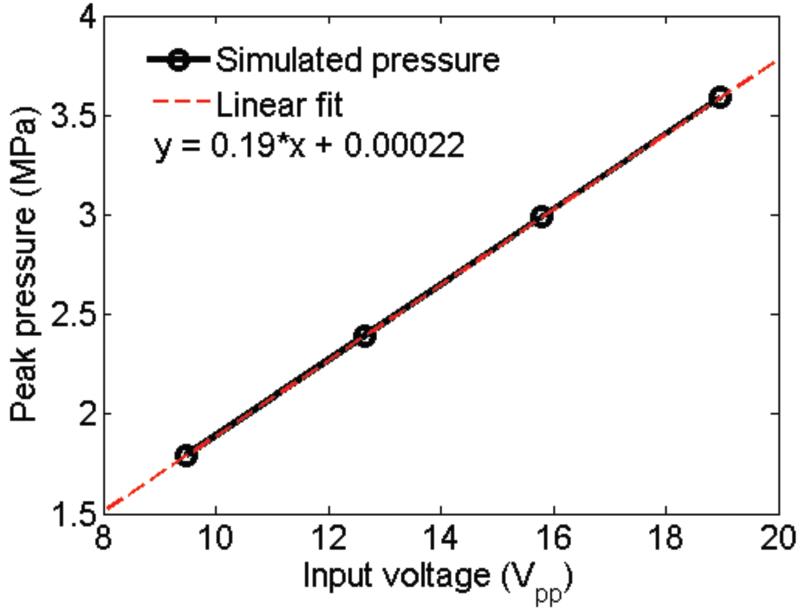
(a) fluorescence intensity of Rhodamine B solution as a function of temperature (b) temperature changes by HFUMS. The HFUM was initiated at 60 s and off at 240 s [PRF: 1 kHz, input voltage: 18.96 Vpp(simulated acoustic pressure: 3.6MPa), and duty cycle: 0.5 %].


