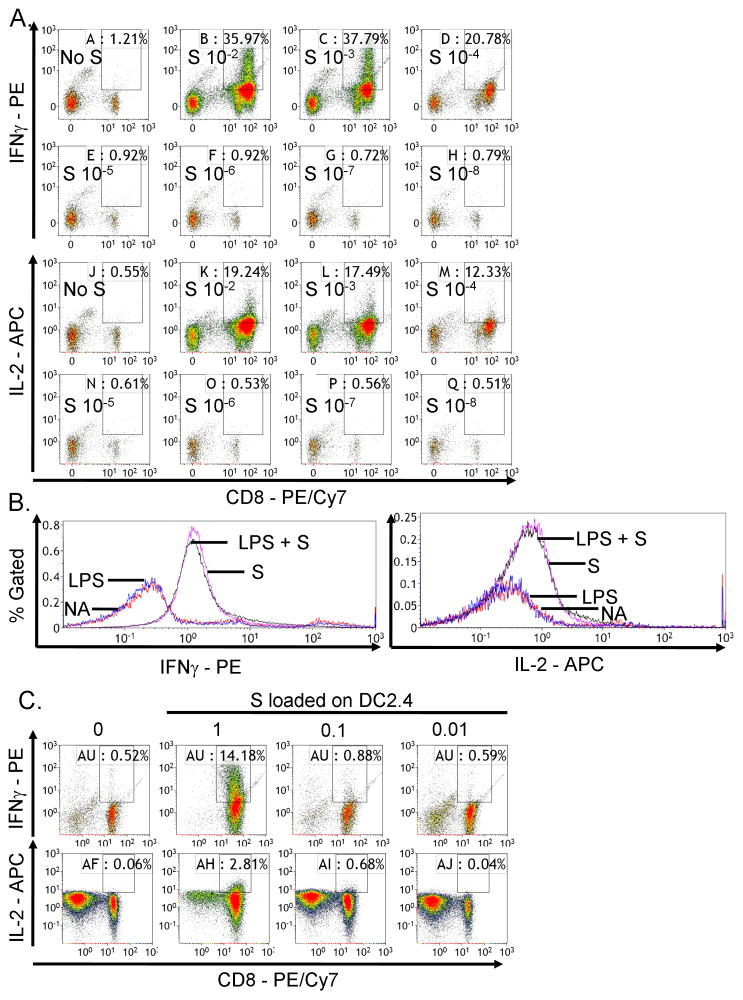
Figure 4.
SIINFEKL concentration-dependent activation of CD8+ T cell responses. (A) OT-I splenocytes (CD8+ T cells, 8 × 10⁵ cells/well) were incubated with various concentrations of SIINFEKL (S) peptide (10−8 to 10−2 μg/ml) for 2 days. Brefeldin A was added during the last 6 h of incubation. Splenocytes were stained for viability, surface CD8 and intracellular IFNγ or IL-2 expression. The percent of IFNγ+ or IL-2+ cells within CD8+ T cells is presented in the quadrants of dot plots, with X axis and Y axis representing the fluorescence intensity for CD8 and IFNγ or IL-2, respectively. (B) DC2.4 cells were pretreated with LPS (1 μg/ml) overnight, loaded with SIINFEKL peptide (1 μg/ml) for 3–4 h, irradiated and plated at 2 × 10⁵ cells/well with 1 × 10⁶ cells/well OT-I splenocytes for 4 days. Splenocytes were restimulated with SIINFEKL (10 μg/ml) in the presence of brefeldin A for 6 h. Splenocytes were stained for viability, surface CD8 and intracellular IFNγ or IL-2 expression. The percent of IFNγ+ or IL-2+ cells within CD8+ T cells is presented in histograms, with x axis representing fluorescence intensity for IFNγ or IL-2 and Y axis representing percent of CD8+ T cells. (C) DC2.4 cells were not pretreated with LPS and incubated with various concentrations of SIINFEKL (10−2 to 1 μg/ml), co-cultured with OT-I splenocytes as described in (B). The dot plots are presented as described in (A). (A–C) Three replicates were concatenated for each treatment in the flow cytometric analysis. Data are representative of at least two separate experiments.

