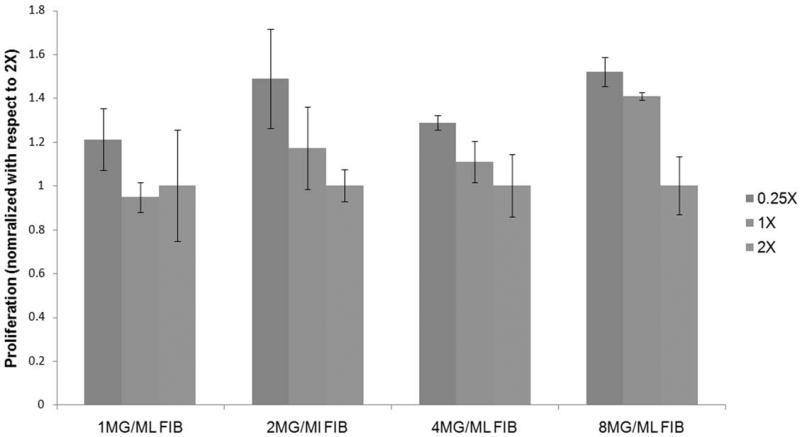
Figure 4.
Comparison of the proliferation of mouse ES cells plated on gels of different fibrinogen concentration and varying cross-linking ratio after 24 hours of plating. Y-Axis represents alamar blue fluorescence. All results normalized with respect to the lowest cross-linking ratio for each group. At all fibrinogen concentrations proliferation was found to decrease as the cross-linking increased. * p<0.05 compared to highest stiffness group.

