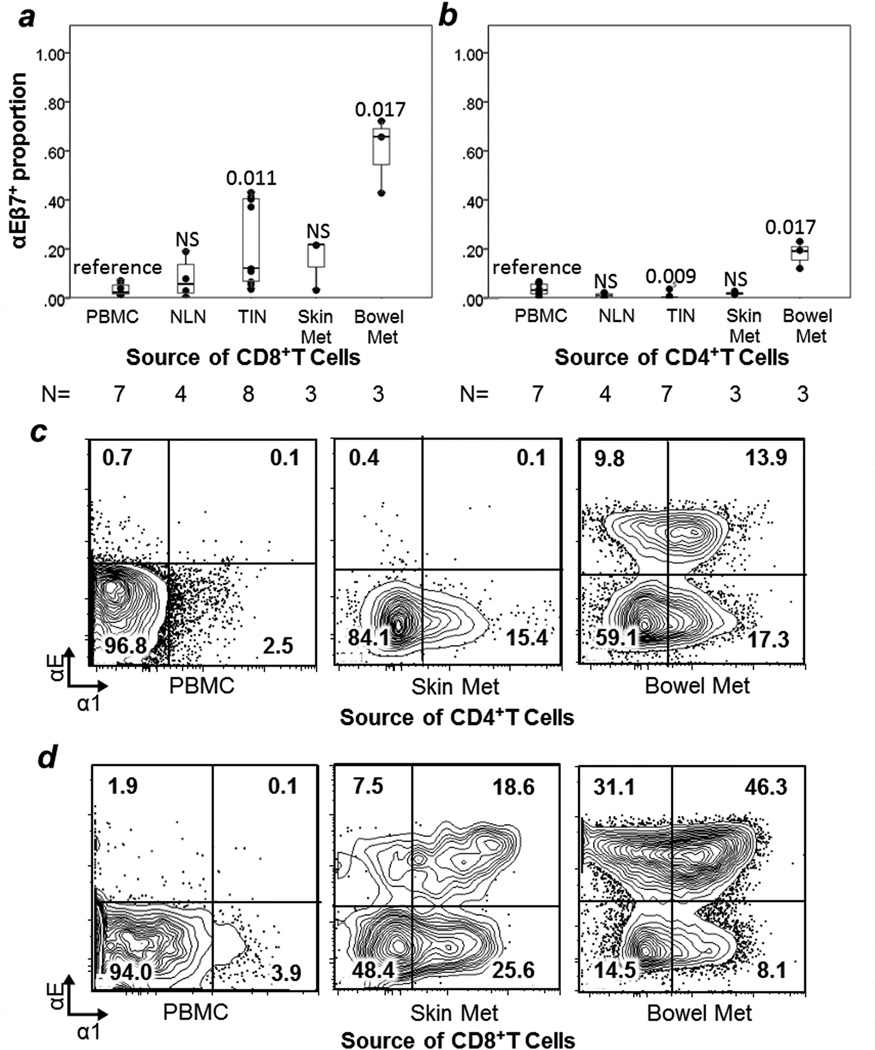
FIGURE 5. Epithelial retention integrin αEβ7 and collagen retention integrin α1β1 expression by T cells.
Box and whisker plots are shown for the mean proportion of T cells expressing integrin αEβ7 with individual data points represented by dots for TCD4 (a) and TCD8 (b). Comparisons are in reference to PBMC, with p values from Mann-Whitney U tests given for each site. NS= non-significant, p≥ 0.05. Examples of individual sample multiparameter flow cytometry of α1 and αE are shown for TCD4 (c) and TCD8 (d). Event counts (left to right): (c) 29,468; 4,981; 20,574. (d) 5,375; 1,396; 33,722. N = number of samples in each category. NLN = normal lymph node. TIN = tumor-infiltrated lymph node.

