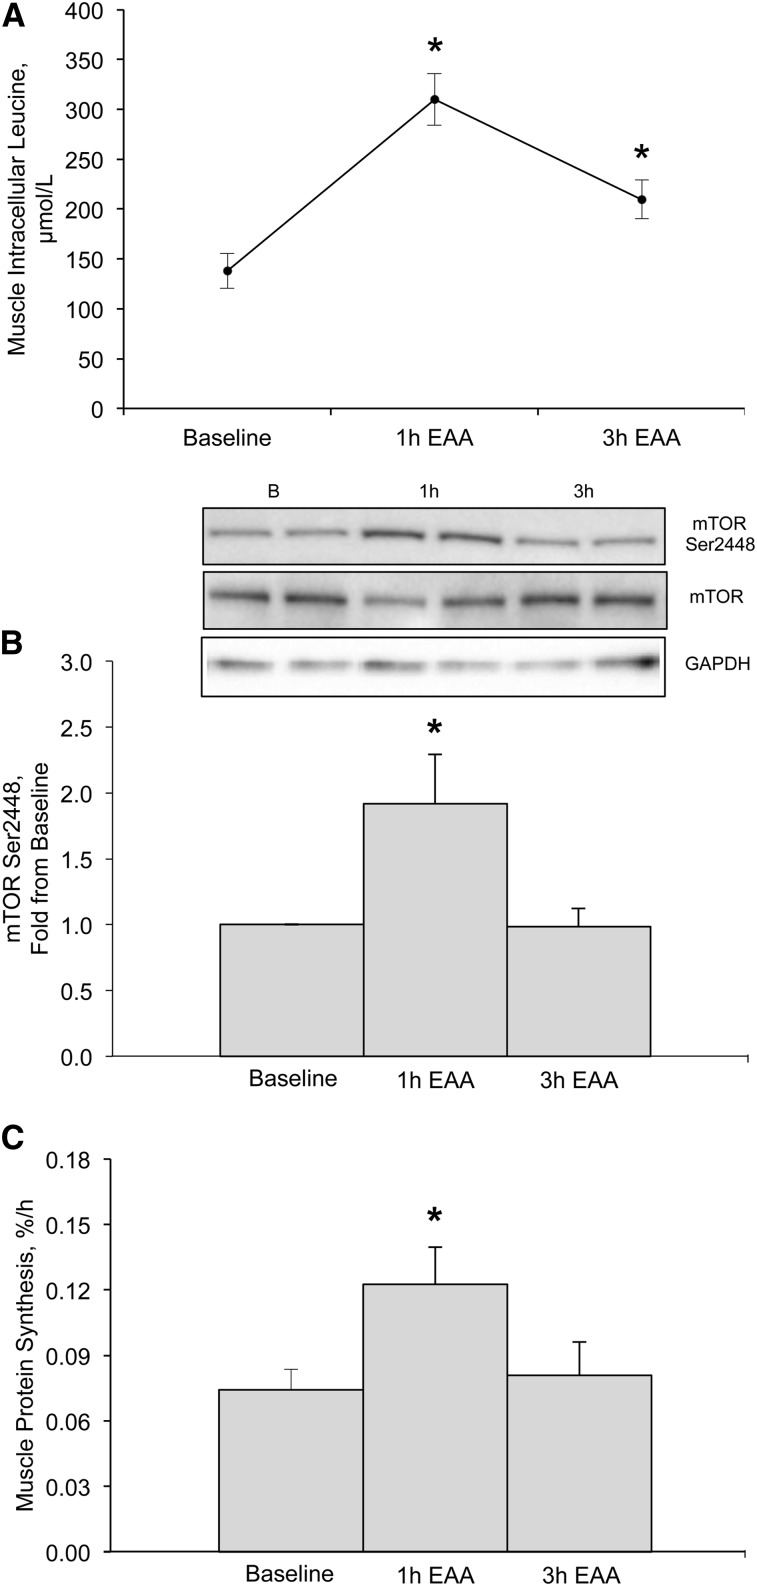
FIGURE 3.
Intracellular Leu concentrations (μmol/L) (A), mTOR phosphorylation (Ser2448) relative to total mTOR (B), and mixed muscle protein synthesis rates (percentage per hour) (C) at baseline and 1 and 3 h after EAA ingestion in skeletal muscle of young, healthy adults. Inset above panel B is a Western blot image representing samples (in duplicate) at baseline and 1 and 3 h after EAA ingestion. Western blot images of GAPDH were used to verify equal protein across sample time points. Data are means ± SEMs (n = 13). Data for panel B are reported as fold change from baseline. Panel A only contains data from 12 participants. *Different from baseline, P < 0.05. B, baseline; EAA, essential amino acid; mTOR, mechanistic target of rapamycin.

