Figure 5.

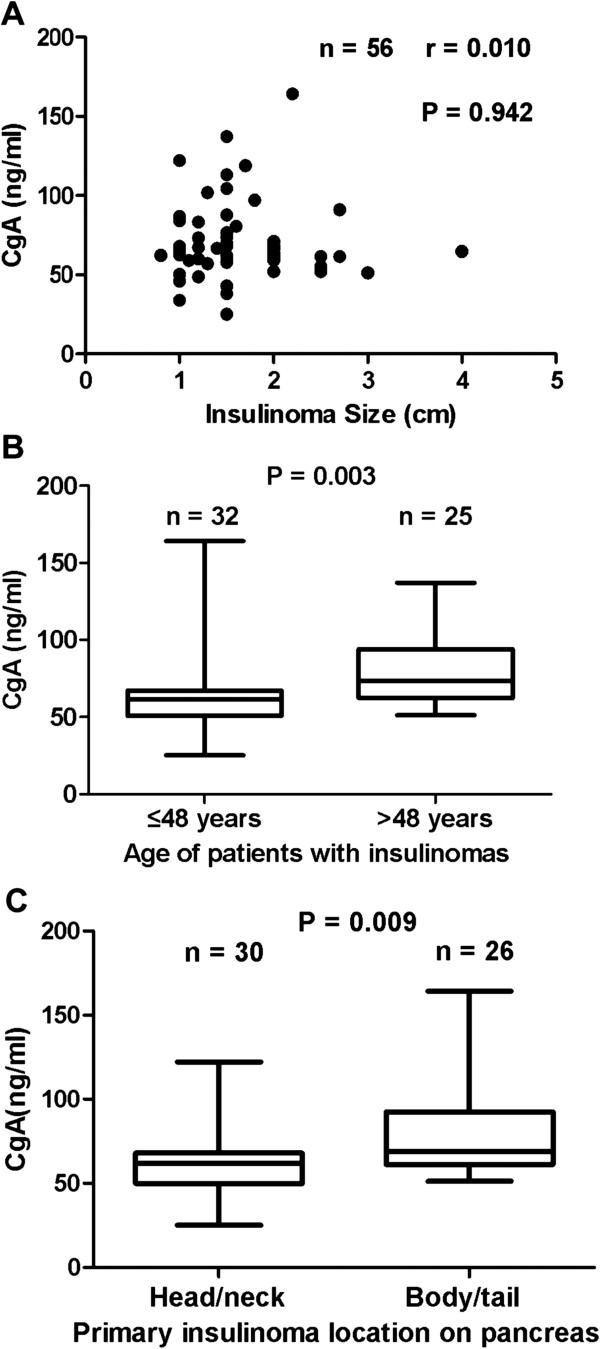
Correlation of serum CgA levels with insulinoma size, primary location and age of patients with insulinomas. Figure 5A The serum levels of CgA did not correlate with insulinoma size (n = 56). Individual CgA levels are presented as dots. Figure 5B The serum levels of CgA in elder patients with insulinomas were significantly higher than that in younger patients (n = 57). The ends of the error bars represent the minimum and maximum of CgA levels in different groups. Figure 5C The serum levels of CgA were significantly associated with primary location of insulinomas (P = 0.009).
