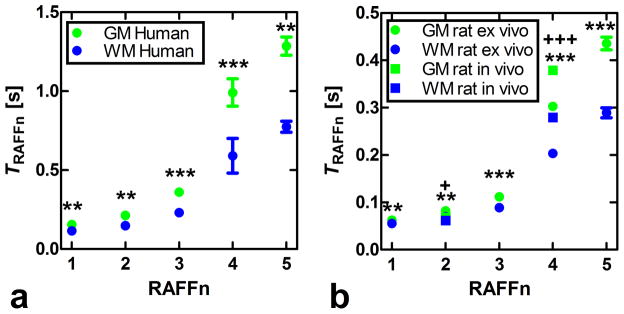
Fig. 7.

Plots of relaxation time constants TRAFFn as a function of n. Data were obtained from a) the healthy human brains and b) ex vivo and in vivo rat brains. Values are mean ± SEM [s]. Statistical analyses using a Student’s t-test were performed for differentiating grey matter (GM) from white matter (WM). For human brain and ex vivo rat brain measurements the ** p<0.01 and *** p<0.001, respectively, were obtained; for in vivo rat brain: + p<0.05 and +++ p<0.001).
