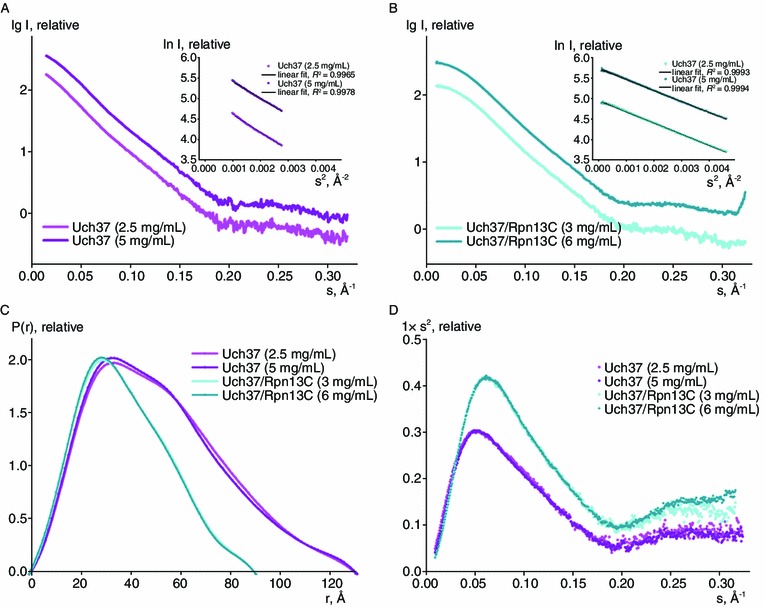
Figure 2.

SAXS analysis of Uch37 and Uch37-Rpn13C. The scattering curves for Uch37 (A) and the Uch37-Rpn13C complex (B) generated from different concentrations of the protein were similar. The P(r) distribution function (C) and Kratky plots (D) of Uch37 and the Uch37-Rpn13C complex were calculated from the experimental data. The plots suggested that there was neither any concentration-dependent aggregation nor any radiation damage during the SAXS data collection
