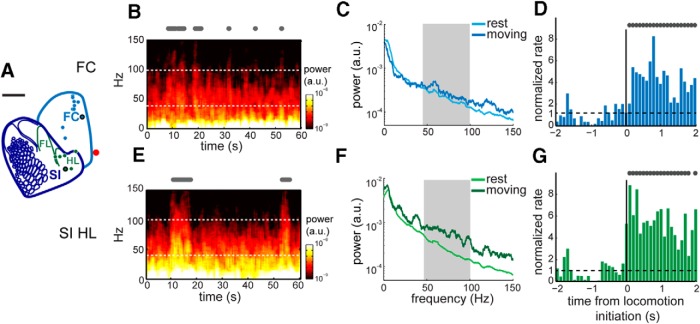
Figure 2.
A, Locations of recording sites corresponding to SI FL/HL representation (green, N = 6) and FC (blue, N = 10). Red dot represents bregma. Scale bar, 1 mm. B, Power spectrogram of LFP recordings over a sample of 60 s in FC. The electrode site is shown as blue dot with black outline in A. Locomotion events are plotted as gray dots above the spectrogram. Gamma-band boundaries are shown in white dotted lines at 40 and 100 Hz, respectively. C, For the same electrode position and recording trial in B, the average power spectra of 5 s bouts of locomotion (dark blue) and rest (light blue) from 0 to 150 Hz. Within the gamma band (gray area), the power during locomotion was significantly higher than during rest. D, For the same electrode position in B, the normalized firing rate for 2 s immediately before and after locomotion initiation (black vertical line). A rate of 1 indicates no change in firing rate from baseline. Locomotion events are shown in gray dots. E, Power spectrogram of LFP recorded from the electrode in SI HL area, shown as a green dot with black outline in A. F, For the same electrode position and recording trial in E, the average power spectra of 5 s bouts of locomotion (dark green) and rest (light green) plotted from 0 to 150 Hz. Within the gamma band (gray area), the power during locomotion was significantly higher than that during rest. G, For the same electrode position in E, the normalized firing rate for 2 s immediately before and after locomotion initiation (black vertical line).

