
Figure 5.
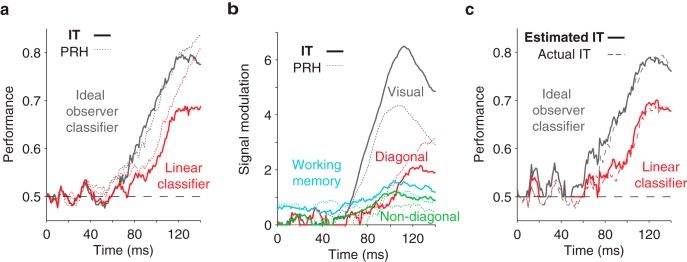
Quantifying population performance and its single-neuron correlates in IT. a, The time course of ideal observer and linear classifier population performance in IT (solid line), and for comparison PRH (dotted line), plotted with the same conventions as Figure 3a. b, The time course of signal modulation components in IT (solid line) and, for comparison, PRH (dotted line), plotted with the same conventions as Figure 4b. c, A comparison of actual (dashed line) and estimated (solid line) ideal observer and linear classifier population performance for IT, plotted with the same conventions as Figure 4c. For both IT and PRH, populations included 164 neurons.