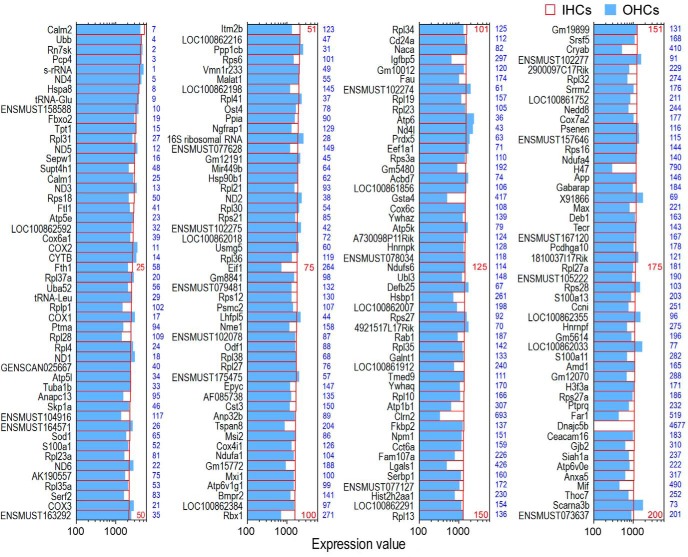
Figure 2.
Expression levels of the top 200 genes in IHCs in descending order. The expression value of the same genes in OHCs is also presented. Numbers in red signify the abundance rank of the genes in IHCs; the numbers in blue on the right represent the ranking of the same genes in OHCs. In this and all subsequent figures, ENSMUST identification numbers are truncated to show the last six digits.

