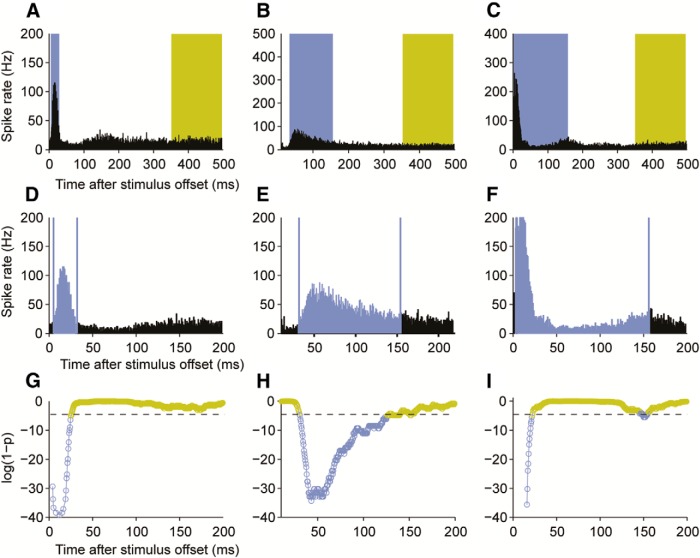
Figure 2.
Representative response patterns observed in three different A1 units after intracochlear stimulation via a CI. A–C, Peristimulus time histograms, over which response periods (blue) and periods of spontaneous activity (yellow) have been superimposed. The start and end times of the response window were determined for each unit using a binless algorithm in which a sliding window was moved forward in time in 1 ms steps, comparing the firing rate within that window with that in a preset spontaneous window. The algorithm automatically resizes the response window based on a trail of activity, and this is terminated when the firing rate that is no longer significantly different from that in the spontaneous window. D–F, To demonstrate algorithm performance, higher-resolution peristimulus time histograms are plotted for these same units, with the estimated response window indicated by the blue vertical lines. Significant responses were most commonly restricted to the first 50 ms (D), although longer latency (E) and more prolonged (F) responses were also observed. G–I, Log(1-probability) of responses for these units as a function of time, where the threshold of significance is indicated by the horizontal broken line. Blue circles represent significant evoked activity. Yellow circles represent activity that is no different from spontaneous levels. Because evoked activity was rarely observed beyond 100 ms, initial bounds of 5–105 ms were set for all units within which the response window was optimized using this procedure.

